We are commonly asked to clarify the differences between R and S surface roughness parameters. This often comes up when someone begins working with a new instrument, part or process that require the use of S parameters. That person may be accustomed to “R” parameters such as Ra (average roughness), having primarily worked with 2-dimensional measurement systems such as stylus profilers. This post gives some background into the two sets of parameters and discusses some of the important differences that may arise when transitioning from one set to the other.
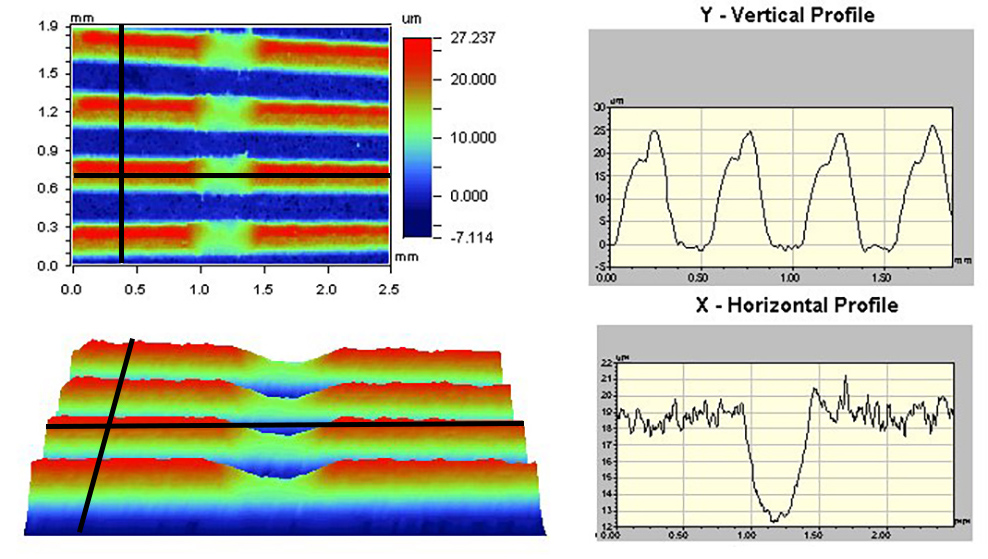
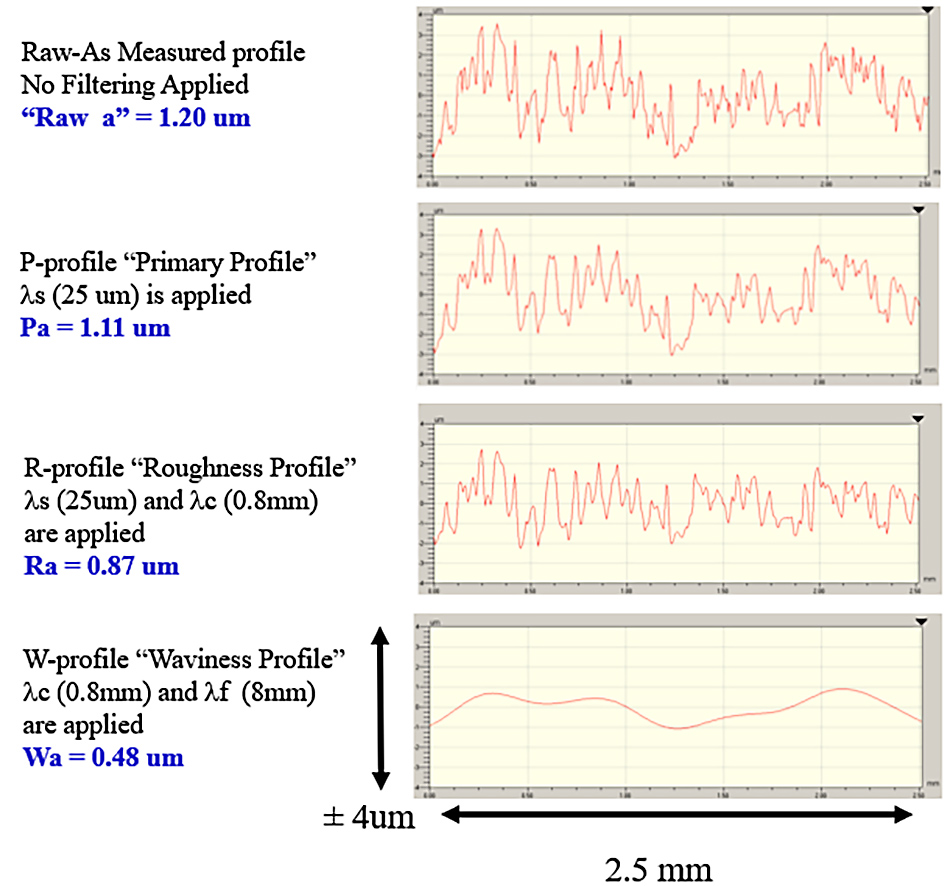
The 2D profiles on the right show slices across the areal (3D) data on the left, in the Y and X directions. R parameters describe the profile data; S parameters describe the areal data.
A brief history of surface roughness parameters
Early surface measurements were essentially derived from record player technology: a stylus moved across a surface, and a capacitor and diode turned the output signal into a DC value to drive an indicator needle. The average of the rectified AC signal was the “average roughness,” abbreviated “Ra.” A few other parameters such as CLA (Center Line Average) were also available. Adding a few more capacitors and resistors netted the RMS (root-mean-square) roughness. These two parameters ruled the surface texture analysis world for several decades.
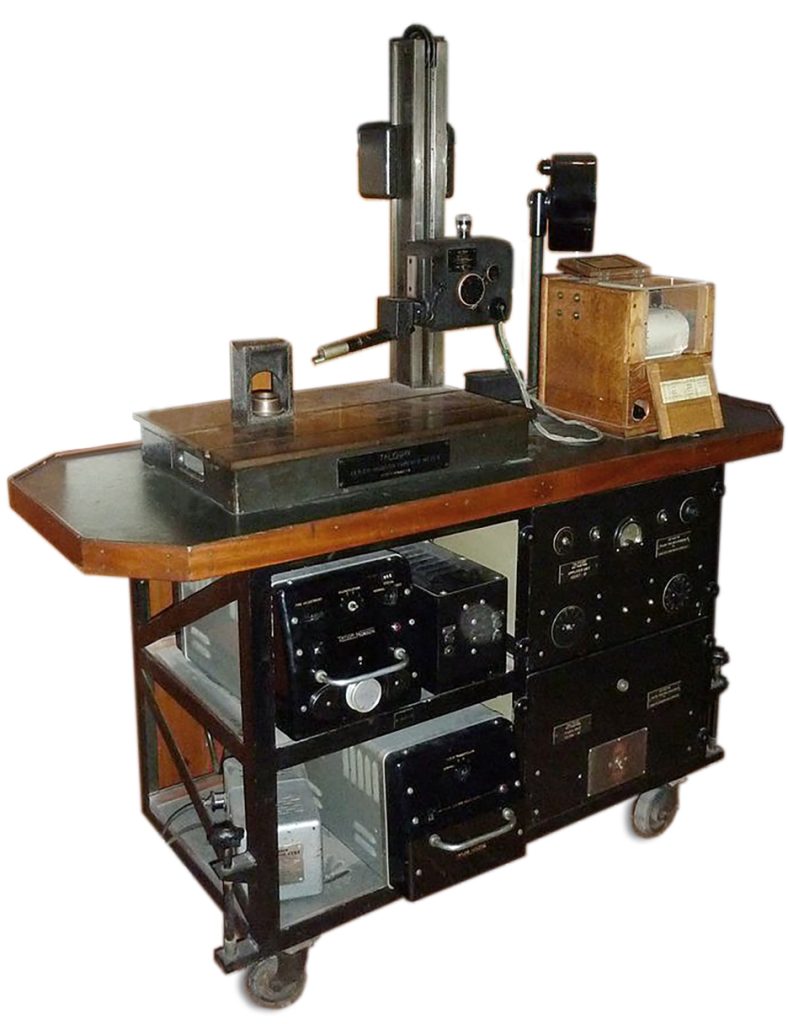
Early “portable” stylus profilers were like elaborate record players, with the needle tracing the surface rather than following a record’s groove.
As measurement technology matured we learned that surface roughness is not always random nor isotropic. Various spatial frequencies/wavelengths affect surface functions differently. The concept of “filtering” was introduced (again, using resistors and capacitors) to help us focus on longer and shorter spatial wavelengths. We could now think of “roughness” and “waviness” as different regimes which might both need to be controlled.
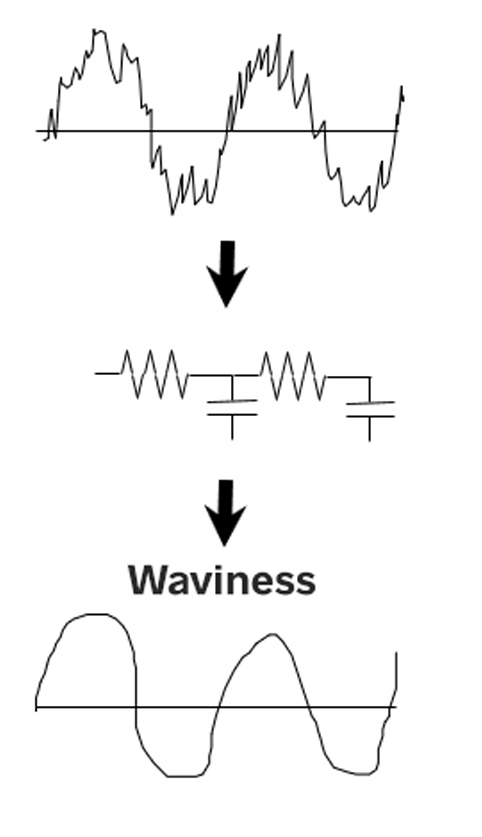
Roughness and waviness profiles were generated by using simple, analog RC filters.
In the 1980s and 1990s a leap in computer power greatly increased our ability to analyze surface data. A wealth of new R parameters were developed to distinguish surfaces in more subtle ways. Concurrently, standards committees began formalizing them to give them universal meaning.
The rise of S Parameters
During this same period instruments were being developed that could acquire “areal” data, gathering swaths of data optically rather than single traces mechanically. The 3D data was a boon for advancing our understanding of how surface texture affects component function.
Instrument developers and users, however, were faced with a new challenge. R parameters had always referred to 2-dimensional measurements; 3D data would provide different answers because the measurement regions differed in size, and the measurement equipment itself interacted differently with the surface.
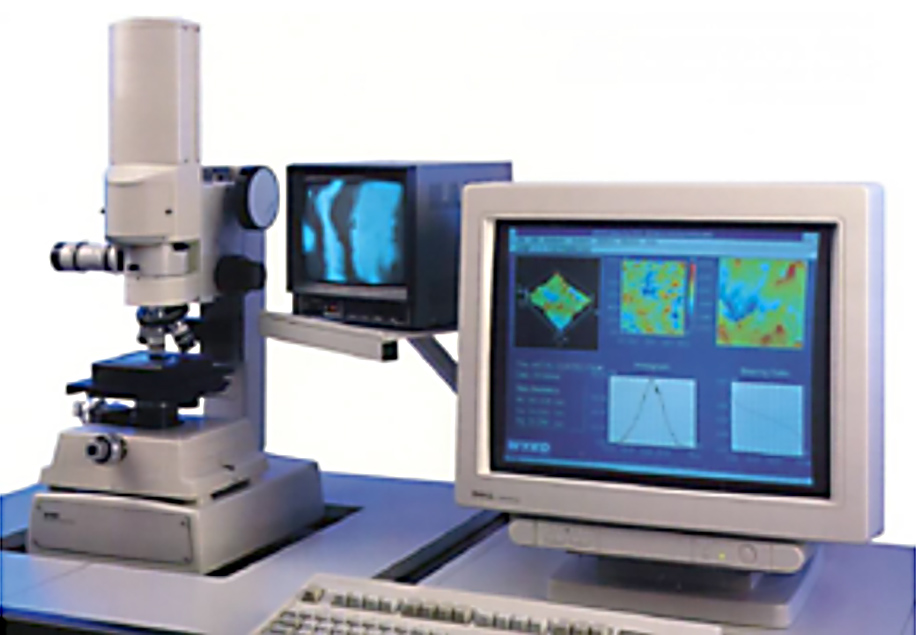
3D optical measurement techniques combined with a sharp increase in computing power led to the first generations of commercial 3D optical profilers.
The need had arisen for native, 3D parameters which could correctly described areal measurement data. The designation “S” was chosen to indicate “surface.” S parameters were developed to provide the 3D equivalent of common R parameters. Additionally, new texture parameters were developed that could describe 3-dimensional aspects of the data which were not part of the R parameter set.
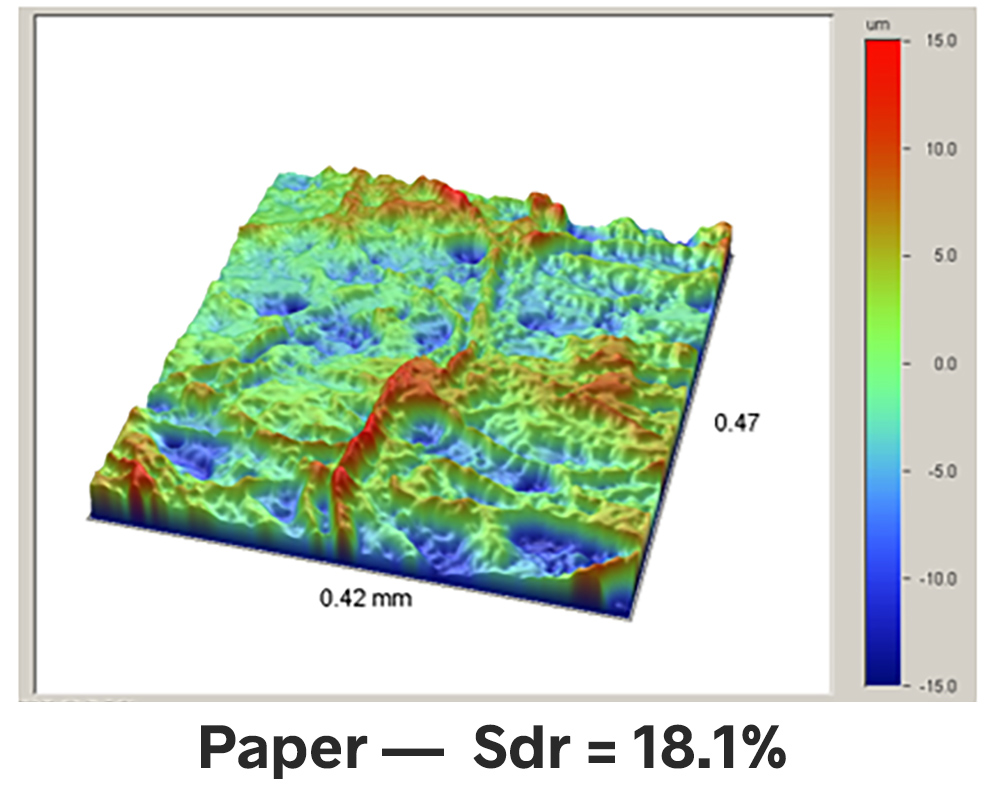
In addition to making it easy to visualize a surface, 3D measurement, and S parameters, made it possible to describe and control complex functional aspects of surfaces.
Both R and S Parameters have important functions
Fundamentally, R parameters describe data derived from a 2-dimensional profile, and S parameters describe data measured over an area of the surface. In the latter case, we use the term “areal” instead of “3-dimensional” data to distinguish surface measurement from dimensional CAD and CMM type measurements.
That said, many stylus profilers now allow multiple traces to be assembled into a 3-dimensional dataset, from which S parameters can be calculated. And, areal measurement systems and software typically include some sort of cross-sectional tool that allows you to analyze a single trace or an average of multiple traces, through the 3D data in order to output 2-dimensional parameters.
One last wrinkle: older 3D instruments built before the development of S parameters may have output “R” parameters based on the entire 3D dataset (as R parameters were the available, and required, parameters). The data from these calculations may correlate to, but not necessarily match, the output of stylus profilers. One must be aware of which data is being used to calculate the parameters in order to avoid misleading results.
Differences between S and R Parameters
f you are new to S parameters, or 3D measurement, there are some important distinctions to consider as you approach the technology.
1. Roughness vs Waviness vs Primary
Those who have worked with 2-dimensional surface measurement instruments are likely familiar with roughness, waviness and primary profiles. As we have seen in other posts on this blog, these different regimes are defined by short and long cutoff spatial wavelengths. These are not absolute values: they are, instead, defined by the application and the size of the features of interest in the surface texture (though standards to provide “default” cutoffs when none have been specified).
Primary, roughness and waviness are key concepts in 2D profiling but are not as well defined in 3D measurement data.
For S parameters it makes more sense to describe “amplitude within a bandwidth” rather than to use terms such as “roughness” or “waviness.” The concept of a “roughness profile” or “waviness profile” does not translate into the 3-dimensional world. We still filter areal data to examine various wavelength regimes within the texture, but the basic concept of R vs W are not really used. This can be disconcerting at first.
2. Directionality
One of the reasons Sa and Ra do not always correlate is that a surface may have strong texture in one direction but not another. Depending on the direction of the trace, a profile measurement may be dominated by that texture, or it may miss it completely. An areal measurement captures texture in all directions, which means S parameters are less susceptible to the orientation of the part relative to the instrument. For example, if one measures the profile along the lay of a highly directional surface, the Ra value based on the 2D profile will not correlate well with an areal measurement.
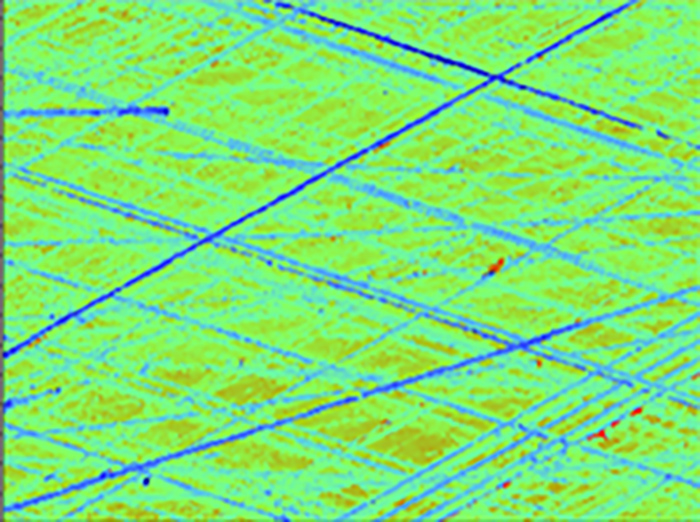
The cross-hatch pattern is clear and well defined in this 3D measurement. A 2D trace across the data would not give as clear an image of the overall texture.
3. Scale of interaction
it is common for a stylus profiler trace to cover tens or hundreds of millimeters in length. This length is long enough to traverse several evaluation lengths. On the other hand, while a 3D optical profiler measurement may appear as a vast landscape on-screen, in reality the entire field of view may only cover a few hundred microns. It is therefore critical to know the size of the features and spatial wavelengths of importance, and to understand the relative size of the measurement area being acquired.
4. Accuracy
As we mentioned earlier, S parameters are less susceptible to part alignment which can make for more repeatable measurements. And, while a stylus trace may be much longer than the field of view of an optical instrument, the 3D dataset still contains thousands of times more data points than the single trace.
It’s also important to remember that different measurement technologies will acquire the underlying data differently as well. A stylus encountering a high peak may deflect around it rather than passing over, thereby flattening the peak in the data. An optical profiler may be limited by the numerical aperture of the objective as to the maximum slope of surfaces that can be imaged.
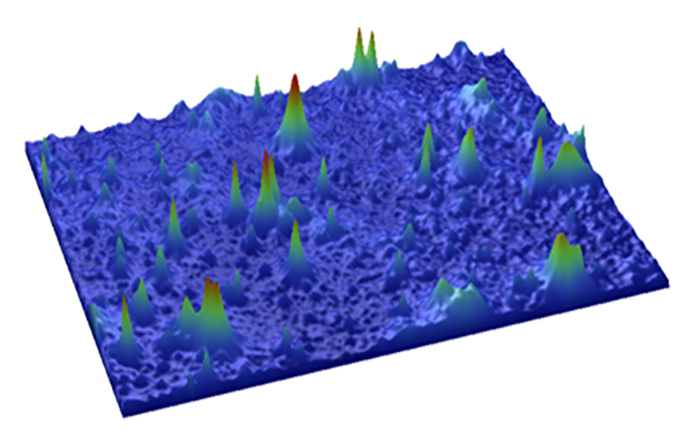
A stylus profiler may press around these peaks rather than passing over them, thereby truncating them in the measured data. Optical profilers have different limitations.
As 3D surface texture analysis progresses, we are seeing the development of an increasing number of parameters that describe how a surface performs its function. This is a departure from purely describing the mathematical shape of the surface text.. We can describe “functional” aspects of a surface, such as how well a surface may seal:
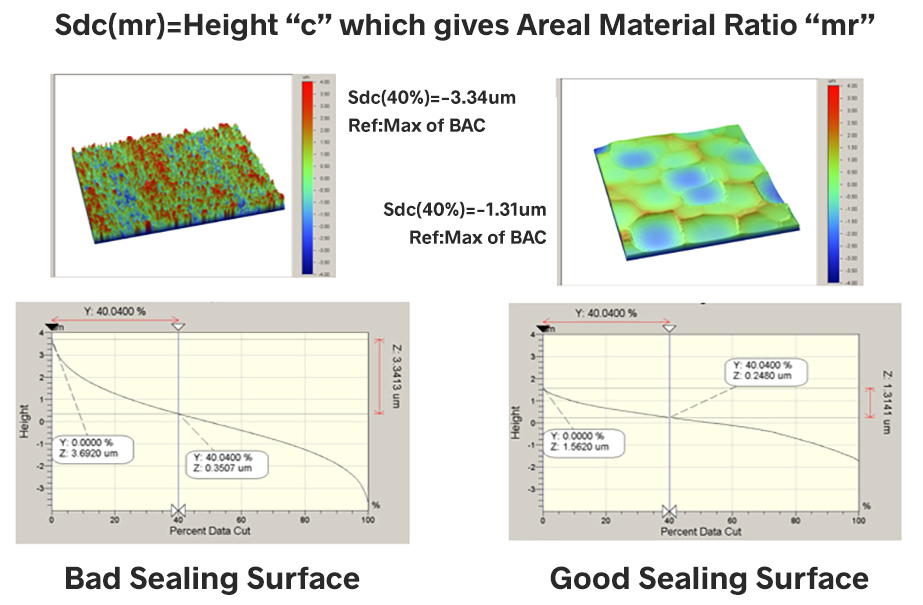
Parameters can be derived from areal 3D measurement data to describe functions, such as how a surface may seal.
“Hybrid parameters” can provide information regarding the aesthetic qualities of a finish, or the ability of packaging to release its contents cleanly.
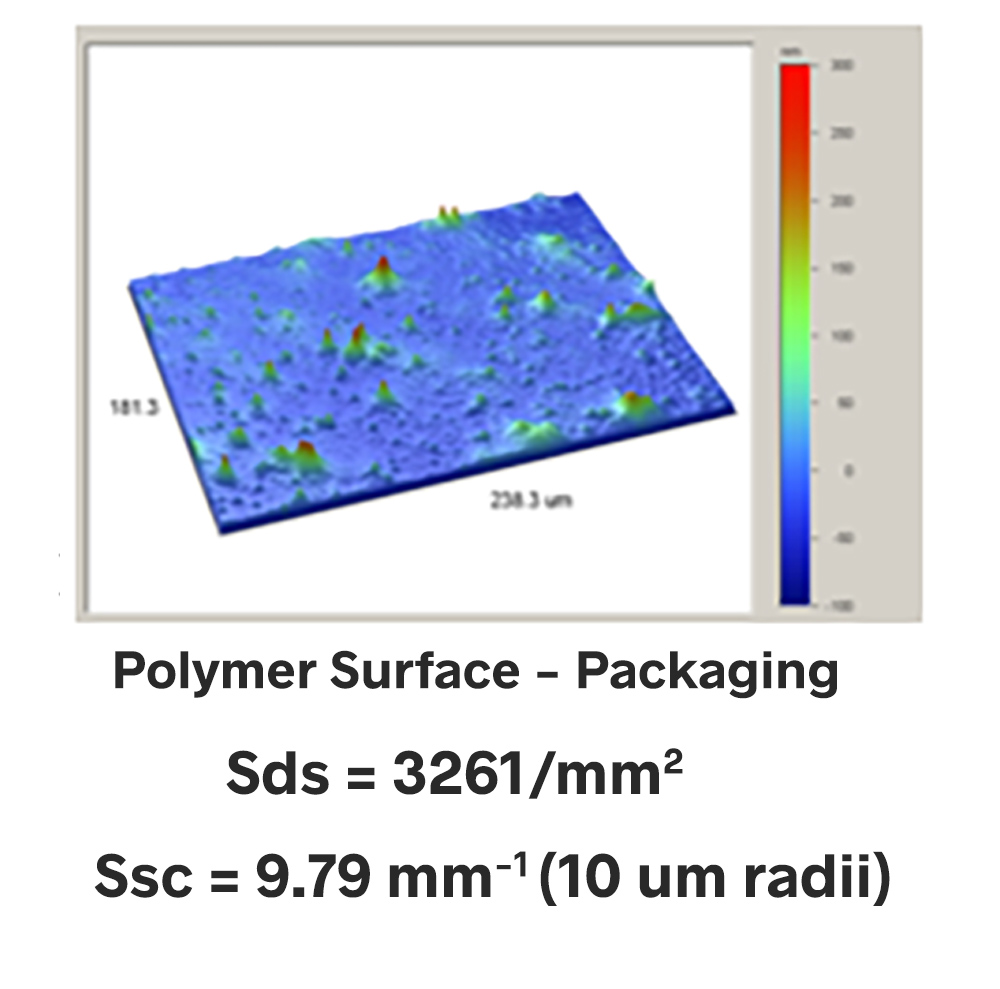
3D texture parameters can describe such functionality as how well a packaging film will release from its contents.
Ultimately, both the R parameters and S parameters hold important roles in surface texture. The key to working with both is to appreciate what information they each can, and cannot, tell you based on the measurement data used to calculate them.
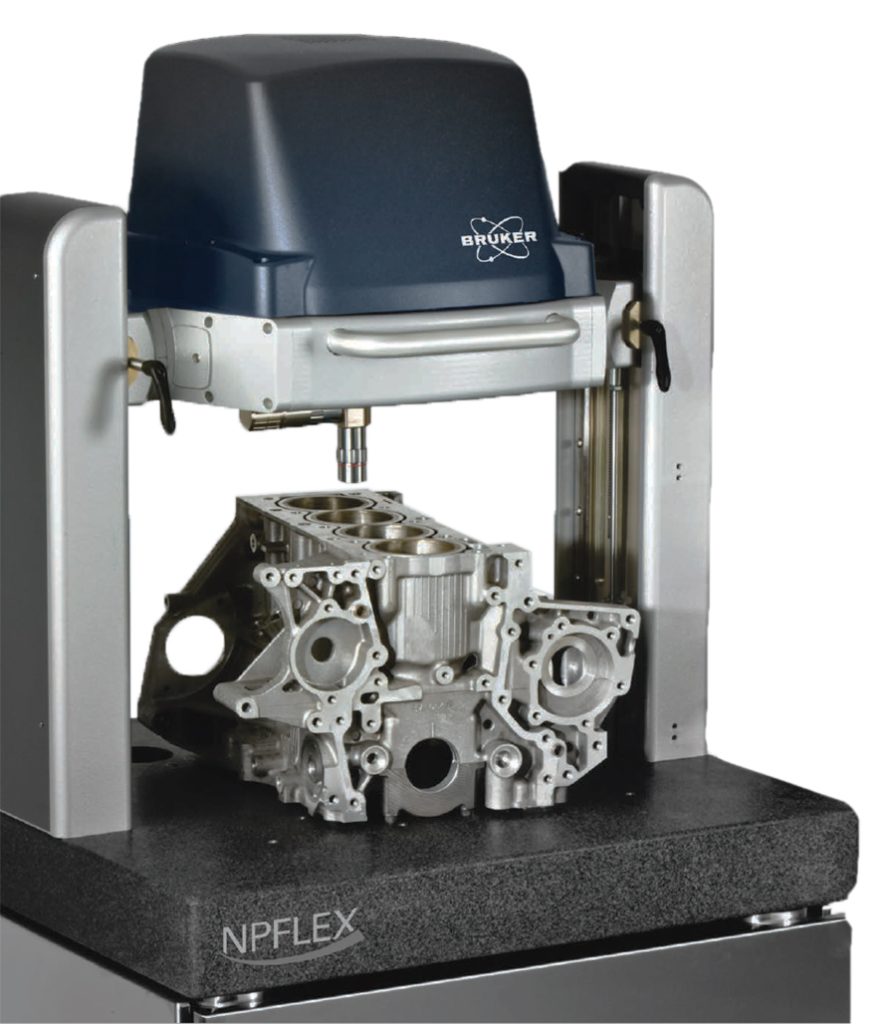
Current state-of-the-art optical profilers, such as the Bruker NPFlex, provide the ability to measure large parts, stitching multiple images together to extend the measurement area from 100 µm x 100µm to 20mm x 20mm—all while maintaining nanometer-level (VSI) and Angstrom-level (PSI) height resolution.
Learn more about the R parameters (Stylus X,Y parameters) and the S parameters in our Surface Texture Parameters Glossary.