Most surface finish specifications for plastics refer to an SPI finish (SPI mold finish). These numbers refer to a standard set of finishes for injection molded parts set by the Society of the Plastics Industry. Comparison plaques like the one below provide representative samples for a variety of finishes.
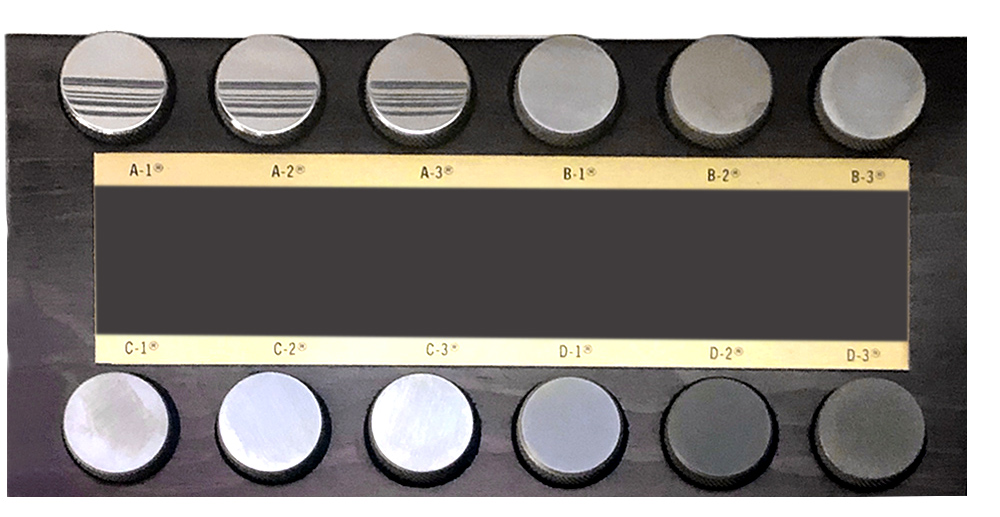
To verify a surface finish, an inspector compares a molded surface to the SPI sample called out in the specification. It’s a quick, qualitative inspection method, similar to the roughness and texture samples that were used for many years in metal machining.
When requirements exceed the standards
The challenge with SPI finishes is that the inspection method is entirely qualitative, based on the judgement of the inspector. For some types of components this inspection method is entirely sufficient (for example, an aesthetic trim panel in a vehicle). In other cases, however, specific qualities of the surface finish that impact function may not be easily determined by eye.
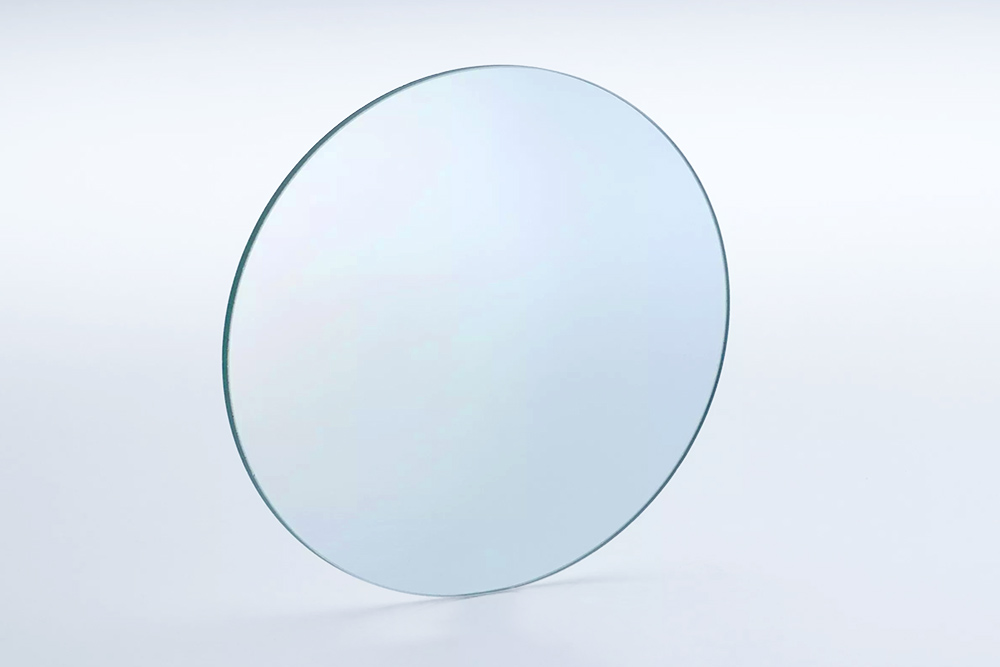
Here is a plastic optical component:
Let’s say the specification calls for an SPI A-1 texture. Can you tell whether this surface is best described as an A-1, A-2, or A-3? We reflected a pattern of parallel lines in the surfaces to make it easier…
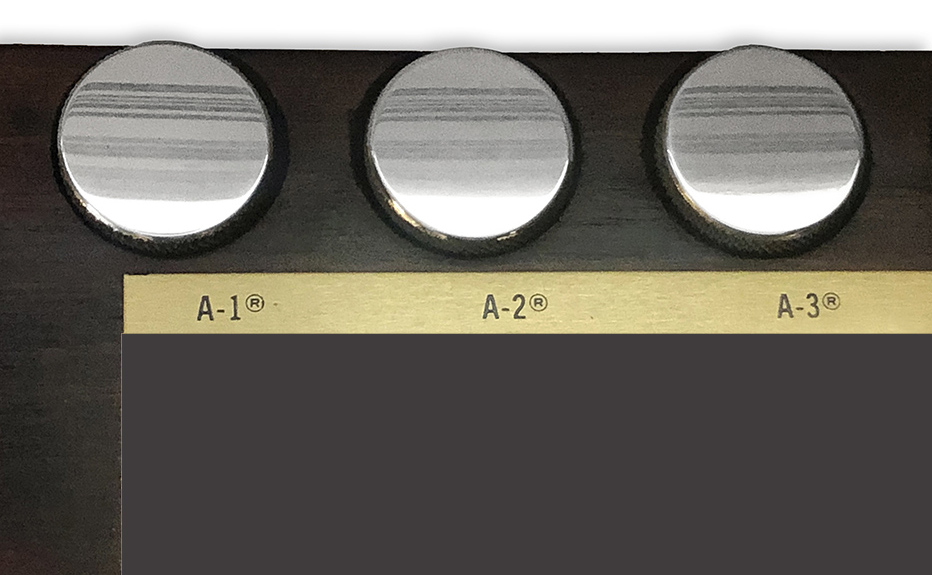
Give up? That’s understandable—it’s difficult to make this distinction. Yet, the optical performance of this component depends on a correct assessment!
Quantitative vs qualitative
In many cases, trained inspectors can develop an intuition for telling a “good” part from a “bad” one. But for higher performance components, qualitative assessment is just not practical. What’s needed is quantitative measurement data that can help an inspector to determine whether the surface will fulfill its function. In some cases, an average roughness measurement from a stylus instrument may be sufficient. In other cases, 3D measurements, and parameters that relate to specific aspects of the texture, may be required to tell good from bad.
Here are the A-1, A-2 and A-3 surface samples on our comparator plaque as measured with our Bruker NPFlex 3D optical profiler:
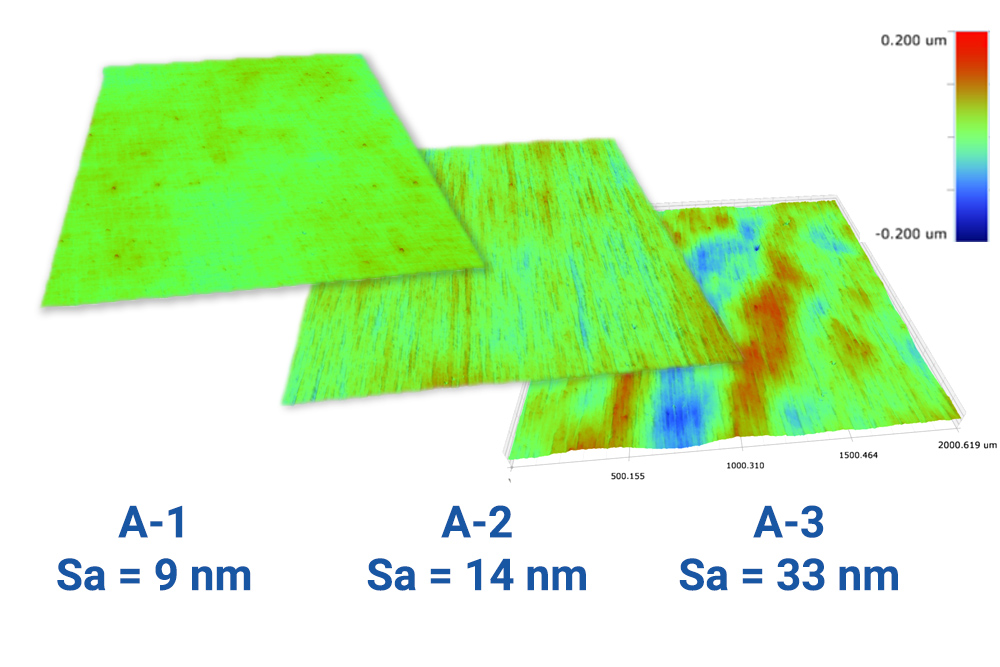
The profiler measurements show that the three surfaces have different average roughness (Sa) values. Though by eye it’s extremely challenging to differentiate the surfaces, they can be readily distinguished by measurements like these.
It’s worth noting that the SPI samples do, in fact, compare to specific average roughness ranges. The A-1 surface, for example, should have an Ra between 12 and 25 nm. The A-1 sample on our comparator is actually “smoother” than this range…while our A-2 sample would qualify as an A-1 finish!
Moving beyond average roughness
Measuring average roughness is an improvement over qualitative inspection. But there’s a lot more to surface texture than just amplitude! Directionality, peak curvature, spacing, etc., may all impact how the surface will perform, as much as (sometimes more than) the average roughness. For example, in the figure above, the A-1 and A-2 measurements show a significant striping pattern from polishing. The pattern is not as pronounced in the A-3 sample, possibly due to a difference in polishing technique. If controlling this pattern is important for the final optical performance, it may prove important to specify a parameter such as Str (a measure of the spatial randomness of a surface).
Choosing the specification for the application
A surface finish specification needs to be based on controlling the aspects of the texture that matter for the application. For many plastic surfaces, an SPI comparison may be sufficient as a quick quality check. For components that have more functional finishes, a quantitative average roughness value may suffice. For high performing surfaces where texture greatly impacts function, other surface texture parameters and more advanced measurement systems may be required to ensure quality.