APSDF
The development of the spatial parameters involves the use of the mathematical technique of the Angular Power Spectral Density Function (APSDF). This section will review the basic concepts behind the APSDF necessary to understand the Std spatial parameter.
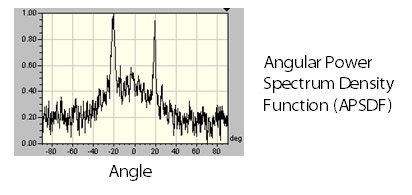
From Fourier analysis, the surface texture is composed of a series of sine waves in all directions with different spatial frequencies (i.e. 1÷ spatial wavelength) and amplitudes. The power spectrum is a measure of the amplitude of each sine wave for a particular spatial frequency, along a given direction. Thus for a 3D surface, the power spectrum would be displayed as a “3D” function in which the X and Y axes represent the various spatial frequencies for a given direction. The amplitude of the power spectrum (displayed on the Z axis) represents the amplitude of the sine wave at a particular spatial frequency direction. The angular power spectrum is found by integrating the amplitudes of each component sine wave as a function of angle. The figures below demonstrate a crosshatched surface, the power spectral density of the surface and the angular power spectral density function.
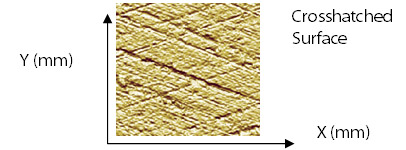
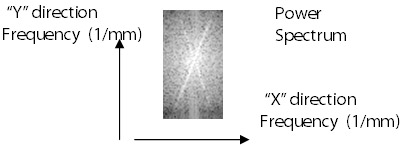
The bright regions of the power spectrum for the crosshatched surface correspond to higher amplitude sine waves at a given combination of spatial frequencies along the X / Y directions. The two dominant bright lines are thus along a direction perpendicular to the two lay patterns of the crosshatched surface. The APSDF is found by integrating the power spectrum from the center out along a given radius and displaying the relative magnitude vs. angle. The two peaks in the APSDF correspond to the large sine wave amplitudes found along directions perpendicular to the two lay patterns of the crosshatched surface.