
It’s easy to recognize a summer day just by the sounds: bird calls, trees rustling, kids playing…maybe lawn mowers and leaf blowers…Somehow, our brains process all that information as “summer.”
Not surprisingly, we see an analogy to surface texture in that!
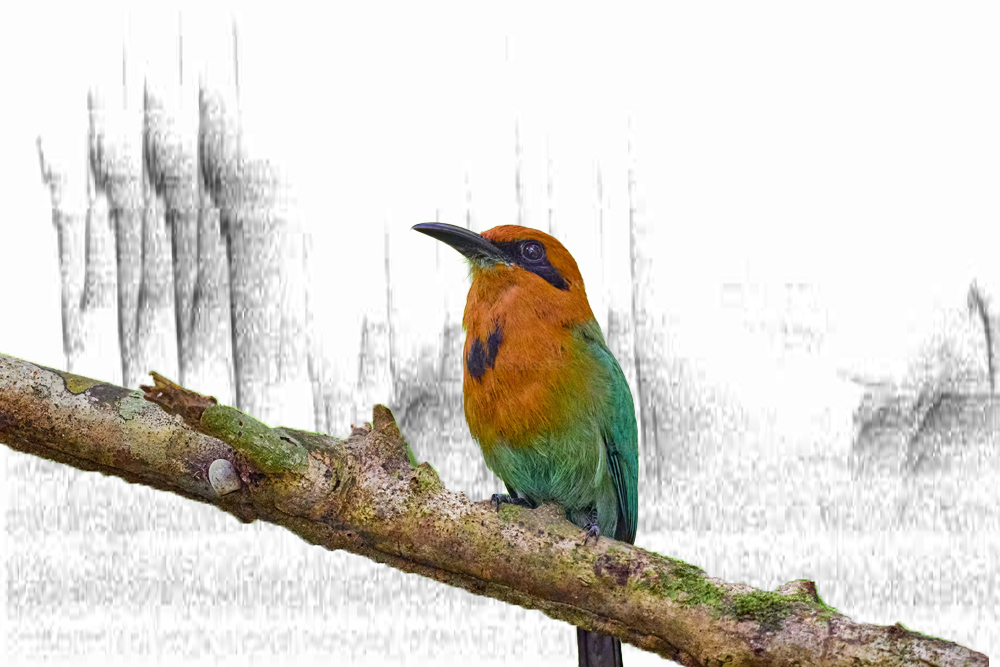
Identifying a bird call, and finding the cause of a surface texture issue, have some striking similarities.
To make a surface that functions well, we need the right materials, the right settings for the machining operations, the right treatments and coatings, etc. In the end, we have a surface that is the product of all those inputs.
Now, let’s say that surface fails in production or in the field. We only have that final surface texture to guide us to the root cause of the failure. Typically, we’d start by measuring good parts and bad parts. Then, we might use surface analysis software or a statistical program to compare many surface texture parameters and see if any obvious differences pop out between “good” and “bad” parts.
Looking at the numbers can help…but not always. In fact, it can lead you to see cause-and-effect relationships that aren’t really there. We often need someone with experience to spot the subtleties that might not show up in the numbers, or to confirm that the difference we do see are meaningful for the particular surface and physics.
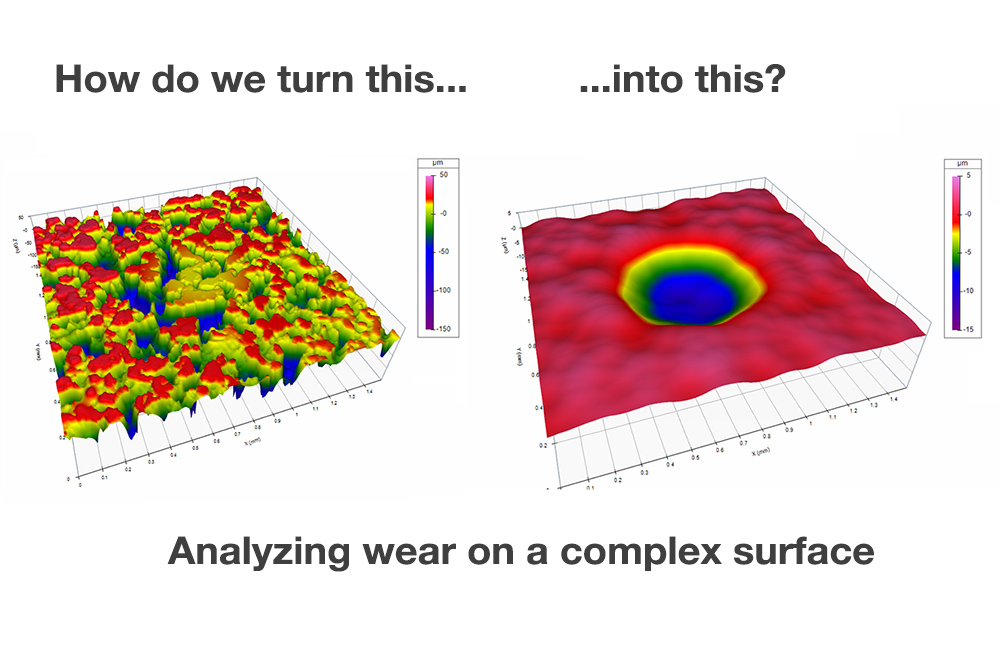
Experience plus analysis power: we worked with Digital Metrology Solutions to quantify the wear scar in this porous surface. Read the article here.
Which brings us back to birds…
Imagine trying to identify one bird call out of many in a forest or noisy urban area. It’s tricky, yet it can be done. Sound ID apps, like the Merlin Bird ID app from the Cornell Lab of Ornithology, identify specific birds despite the noise of the surroundings. The Merlin app analyzes a “spectrogram” (below), which plots the frequency response over time (and looks surprisingly like a roughness profile!). The app uses a complex algorithm to analyze the spectrogram and predict which birds it “hears.” What makes the app so successful, though, is that human experts review the results and confirm the findings as part of the development process. The “magic” of the app is in that combination of tech and expertise.
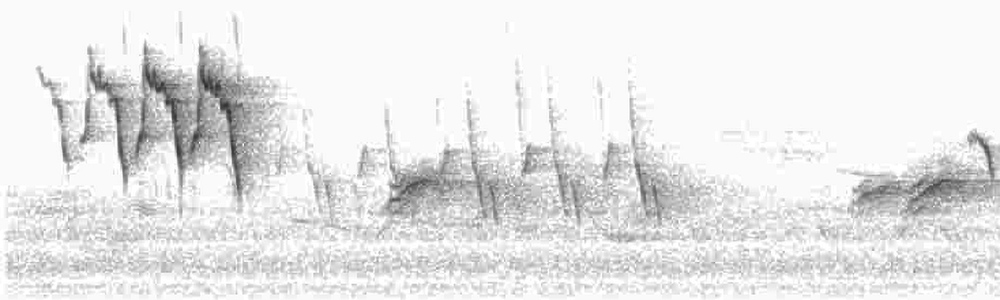
A spectrogram from the Merlin Bird ID app: an example of powerful analysis combined with expert confirmation.
We see this all the time in our work with surface texture. In NVH (Noise, Vibration, and Harshness) analysis, for example, the sound of surfaces in contact helps experts identify the wear mechanisms at work. In a brake system, for example, scratching from hard particulates, adhesive wear, and abrasion from trapped debris all have unique sound signatures. An expert can use this information to design better materials and systems that minimize noise when brakes are new, and when they’ve been driven for thousands of miles.
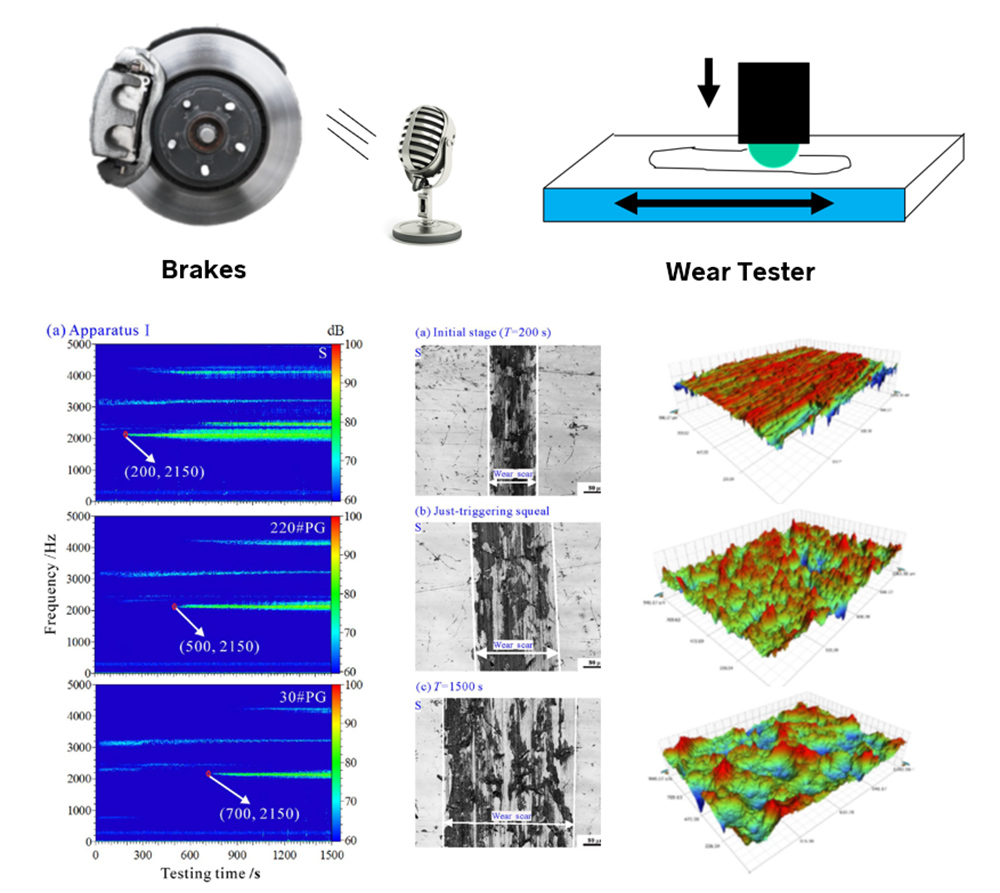
Studying friction-induced noise: the amplitude of each frequency changes over time as the test part wears.*
When you’re trying to solve a challenging production or warranty issue, it’s easy enough to find differences in parameter values…but an expert can make sense of that information to help find the answer despite the “noise.”
Got a challenging production measurement or warranty issue? Contact us—we’re happy to help!
Learn more about the Merlin app here: https://www.macaulaylibrary.org/2021/06/22/behind-the-scenes-of-sound-id-in-merlin/
* Effect of surface roughness on friction-induced noise: Exploring the generation of squeal at sliding friction interface, Wear 402–403 (2018) 80–90, A.Y. Wang, J.L. Mo, X.C. Wang, M.H. Zhu, Z.R. Zhou