The average roughness parameter (Ra, or Sa for 3D measurements) is helpful for spotting changes in a surface or in surface-forming processes. A common question, however, is: how much of a change matters?
Sometimes the change is large and the effect is immediate. At other times, however, the picture may not be so clear.
Three times a small number is…still a small number
Say we have a finely ground shaft, perhaps with a 0.1 µm Ra max surface roughness specification. Let’s say the shaft is designed to contact an elastomeric lip seal, and we find that some of those seals are leaking.
Our first step would likely be to measure some “bad” parts that are associated with the leaks and some “good” parts that did not leak. On the “bad” parts we measure Ra values around 0.07 µm, while on the “good” parts our Ra values are closer to 0.11 µm. We might say, “Aha! There’s the difference!” and start tweaking our grinding processes. But hold on…
When differences like this appear in surface data, it’s important to consider what they physically mean before acting on them. In this case, the finish on these shafts is very fine to begin with. That 0.04 µm difference between our “good” and “bad” Ra values—only 40 nm—is on the scale of individual molecules! If an Ra difference of a few molecules matters, then we have a BIG PROBLEM: this process is going to be incredibly hard to control.
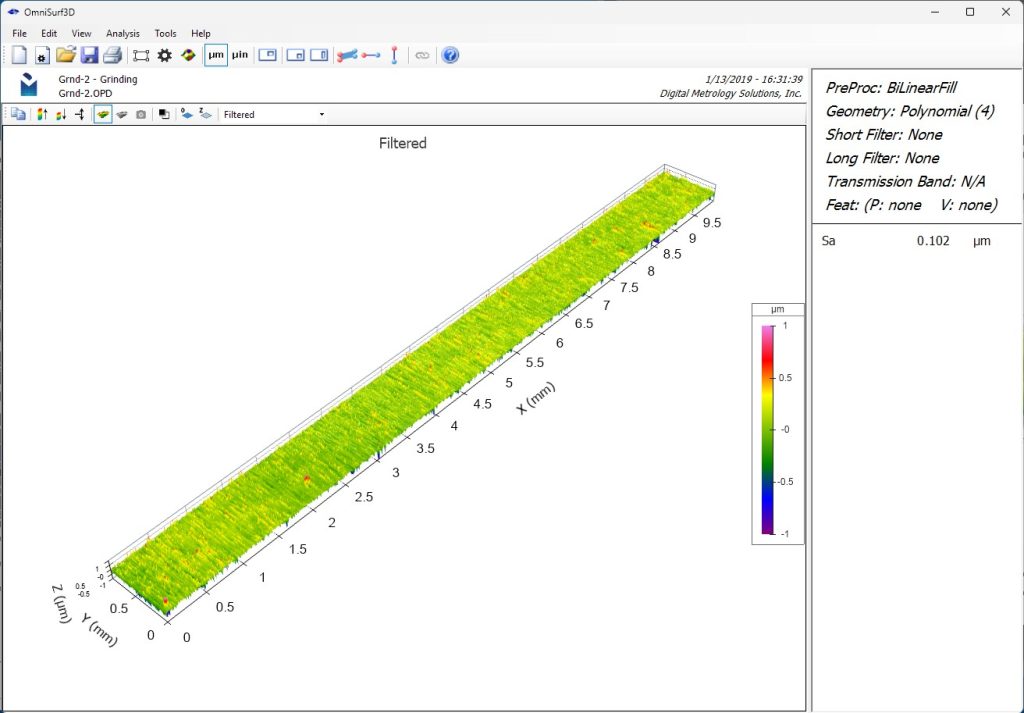
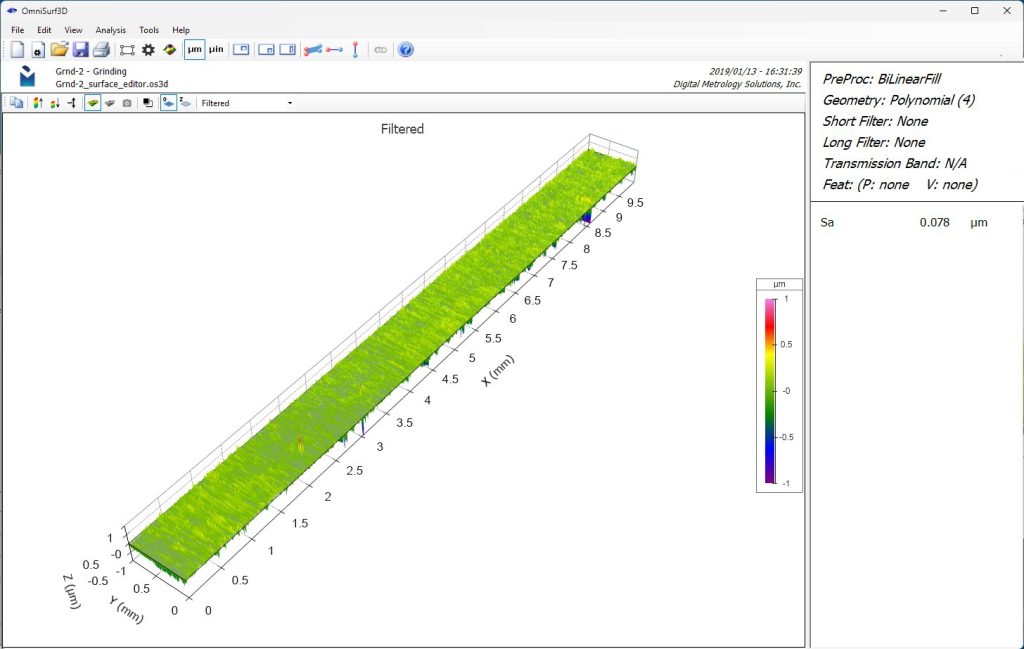
The Ra difference between these two measurements is more than 25% of the actual Ra spec…but it is ALSO only 40 nm.
Granted, some sealing interfaces may require this level of control (an interface with a thin lubricant film on a smooth bearing, perhaps). However, for a typical elastomeric seal on the outer diameter of a ground shaft, that difference should be negligible. The cause of the leaks is more likely related to the lubricant, or the seal, or the environment, or another factor impacting the interface.
Statistical packages can mislead
When we see discrepancies like this in roughness data, we may turn to statistical analysis packages to tell us whether the differences are significant. But that approach may not always be productive.
Let’s go back to the “good” and “bad” shafts. With a fine grinding process, the finish is likely to be very consistent across the surface. The standard deviation of those measurements may be only 0.004, or 5%. These are tiny numbers; yet, if we ran a statistical t-test on these measurements, it would say that the “good” and “bad” Ra values are statistically different!
Don’t let a materials issue slip past
That difference in average roughness may also point to a subtle problem with material properties (assuming the machining has remained the same). It could also indicate that the machining process has affected the final material properties. Adjusting the machining process to get the desired average roughness may not improve the issue that caused the problem in the first place. In fact, doing so may mask the underlying issue!
Let physics be the referee
With the powerful measurement systems, data analysis, and statistical packages at our disposal today, it’s easy to lose sight of the underlying meaning of the data. Despite all of that power (or perhaps because of it!), we have to go back to basic physical properties, and the scale of interaction, in order to make smart decisions based on the data we’re seeing.