The Stylus (X, Y) parameters (Rk, Rpk and Rvk) are derived from the Bearing Area Curve, based on the ISO 13565-2:1996 standard.
The Bearing Area Curve, (also called the Bearing Ratio Curve, or the Abbott-Firestone curve) is plotted by passing a line progressively downward through the surface, from highest peak to deepest valley. The curve gives the ratio of material in the profile at any given depth, compared to a perfectly flat and smooth profile.
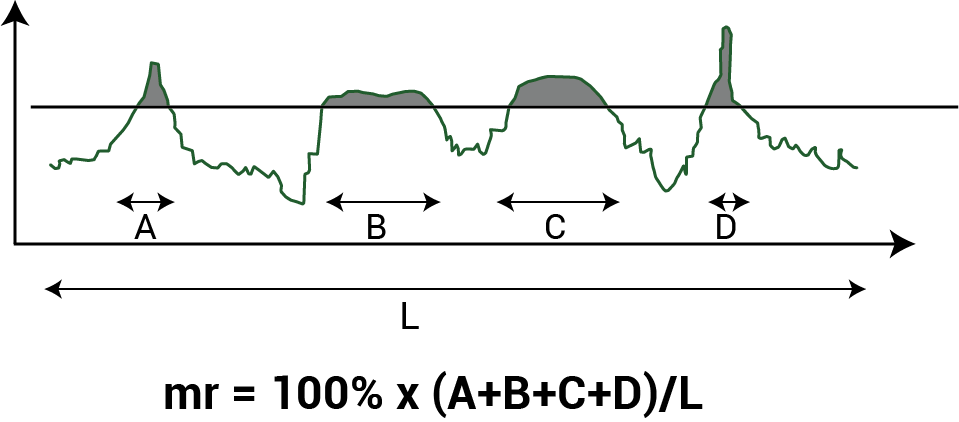
The Material Ratio (Mr) is that ratio of material in the profile to a perfectly flat and smooth profile, at a given height above the mean plane.
Bearing area curves are helpful in understanding the real contact area of mating surfaces and the change to that contact area as mechanical parts wear (e.g., Rpk). It is also useful in determining lubricant retention for engine components, ink retention for printing applications, etc (e.g., Rvk).
Stylus (X,Y) Rk, Rpk, Rvk
The Stylus (X,Y), Rk, Rpk, and Rvk parameters are calculated based on the bearing area curve and represent the heights of the peaks, valleys, and core roughness, respectively.
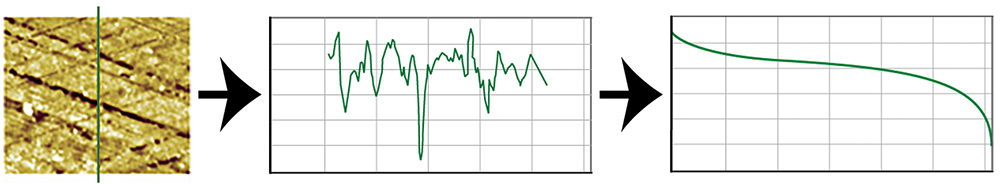
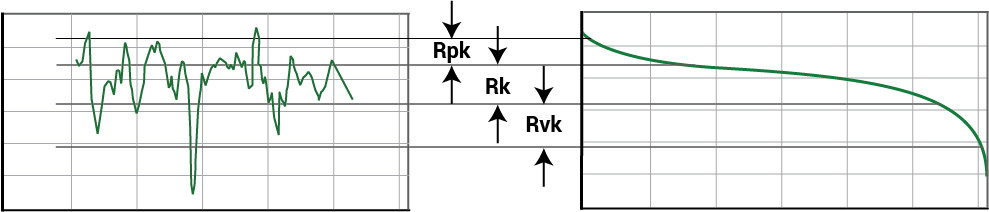
The image below shows a depiction of the bearing area calculation for the Stylus X and Y parameters. A slice in the Y direction across the contour plot (A) produces the Y profile (B). Lowering a line, parallel to profile, through the profile from the highest peaks to the lowest valleys results in the bearing area curve (C):
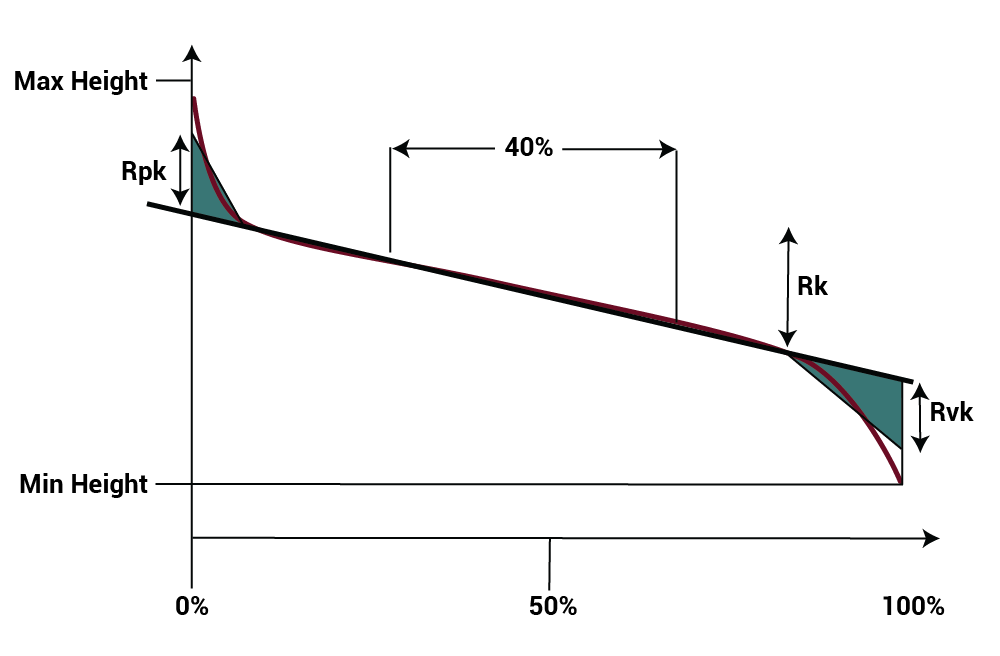
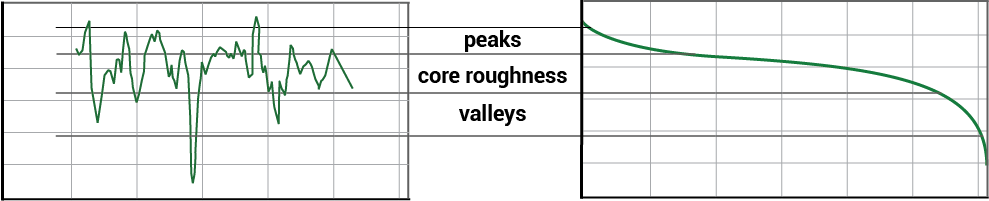
To evaluate the Rk statistics we separate the curve into regions: peaks, valleys, and the “core roughness” or “kernel.” The exact algorithm for calculating these regions has some complexities that are spelled out fully in the ISO standard.*
Rk is then defined as the peak-to-valley height of the core roughness region. Rpk is the height of the peaks above the core region, and Rvk is the depth of the valleys below the core region.
Since this profile was made in the direction of the Y axis, the parameters are specifically called:
- Stylus (Y) Rk, the Core Roughness Along Y
- Stylus (Y) Rpk, the Reduced Peak Height Along Y
- Stylus (Y) Rvk, the Reduced Valley depth Along Y.
A trace in the direction of the X axis produces the same parameters along X.
For a 3D measurement, the 3D counterparts to these parameters (Sk, Spk, Svk) are calculated by passing a plane through the surface from the highest peak to the lowest valley. The algorithms for these calculations are based on the ISO 13565-2 standard.
Application
A surface with a high value for Stylus (X, Y) Rpk implies that it is composed of high peaks providing small contact area. This condition often indicates areas where high stress would occur when the surface is contacted. We encounter this condition with brand new engine parts, for which peaks from machining processes have not yet been worn down by the “running-in” period. Stylus (X, Y) Rpk may therefore also represent the height of the material that will be removed from the surface during the running-in period.
The valley depths below the core roughness, measured by Stylus (X, Y) Rvk, are areas where lubricant may be retained, or debris may become trapped.
Stylus (X, Y) Rk serves as a measure of the nominal roughness (peak-to-valley) of the surface. The repeatability of Rk is less affected by anomalous peaks and/or valleys that do affect parameters such as , Stylus (X, Y) Rt, or Stylus (X, Y) Rz. This immunity to outliers makes Rk an excellent substitute for these parameters when dirt, measurement noise, or other sources of outlying data affect the data.
Lastly, we can compare the parameters along the different directions to assess the uniformity of the surface and the distribution of peaks and/or valley in a particular direction of interest.
Read more about the bearing area curve in the Texture Parameters Glossary.
* The ISO standard defines an algorithm for removing outlying peaks and valleys before the curve calculations are made, in order to produce more robust and repeatable set off parameters.