Ra, the roughness average (or average roughness), is the average of the surface heights along a measurement trace.
Sa is the average roughness over a measurement area.
Can we calculate Sa by averaging the Ra of every trace across an areal measurement? The answer is: no. Here’s why.
Calculating Ra
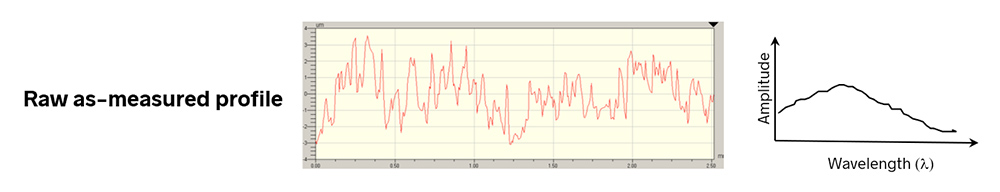
As a refresher, to calculate Ra we start with the raw, 2D trace as shown below. The trace will consist of some spectrum of spatial wavelengths, ranging from short-wavelength roughness through longer wavelength waviness and form.
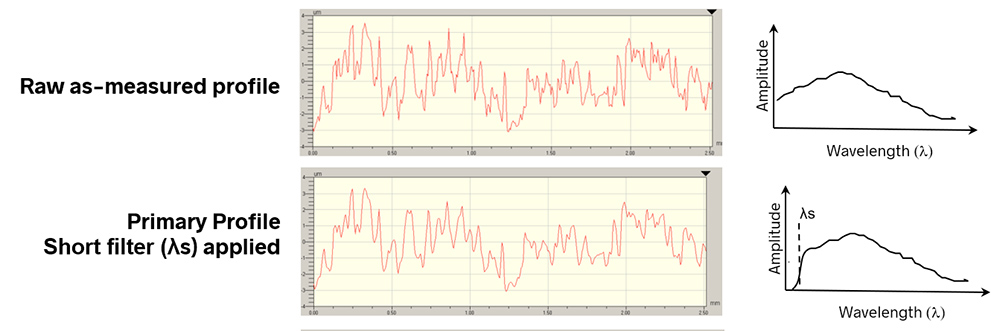
We apply a short spatial wavelength filter λs to the data to attenuate smaller wavelengths that may be noise or that may not be important for the application. The resulting data is called the Primary profile.
Next, we apply a roughness filter λc at the roughness cutoff wavelength. We designate the spatial wavelengths shorter than this cutoff as “roughness” and the longer wavelengths as “waviness.” This procedure gives us the Roughness profile and the Waviness profile.
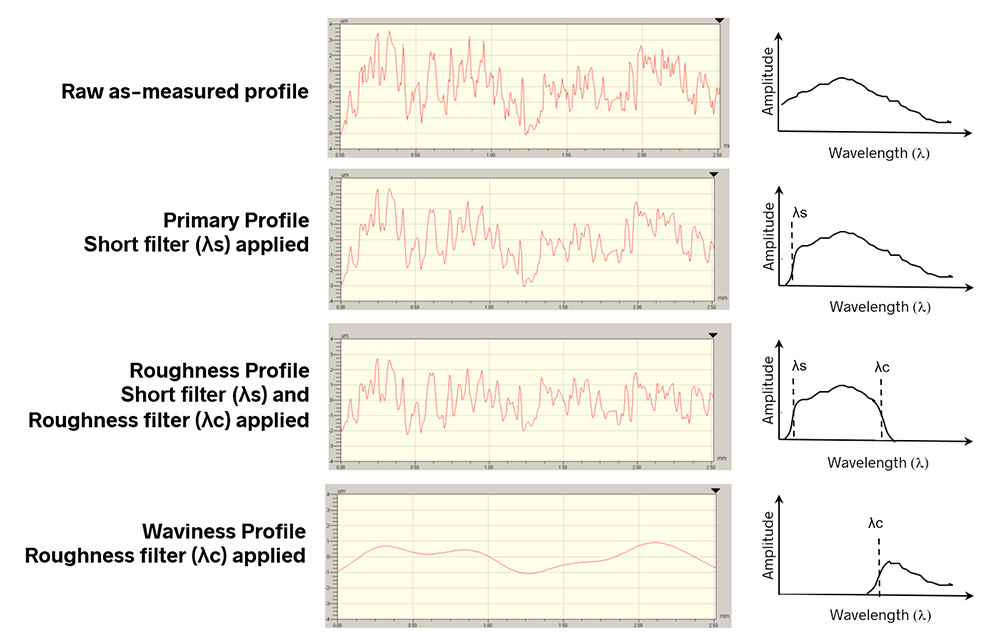
We now calculate the mean height for the Roughness profile (or the Waviness profile). Ra is the sum of the deviations from the mean height of the Roughness profile (and Wa is the sum of the deviations from the mean height of the Waviness profile).
Calculating Sa
To calculate Sa, the average roughness in a 3D measurement, we first acquire an area of data (say, 1mm x 1mm). Again, we apply a short filter to remove spatial wavelengths that may be noise or that may not be important for the application Then, we apply a long wavelength at the roughness cutoff wavelength. We calculate a mean plane for the remaining data, and we calculate Sa as the sum of the deviations from this plane.
Calculating Stylus X Ra and Stylus Y Ra (XRa and YRa)
Some 3D analysis software includes parameters called XRa and YRa, or Stylus XRa and Stylus YRa. These parameters are calculated over a 3D dataset as follows:
- Determine the mean height of each trace in either the X or Y direction
- Adjust each trace so that its mean height equals 0
- Calculate the Ra value for each trace, and
- Average the Ra values of all the traces.
The Stylus Ra parameters are not covered in standards, though they do have their uses, as we will discuss later.
How do Ra, Stylus Ra, and Sa differ?
By definition, R parameters are derived from 2D data, and S parameters are calculated over an areal (3D) dataset. Ra is always a 2D parameter, and Sa is always calculated over an area. A “3D” version of Ra is not defined in standards.
The Stylus (X,Y) Ra parameters are not equivalent to Ra because they are calculated over many 2D traces rather than over just one trace.
Stylus (X,Y) Ra parameters are also not equivalent to Sa. The key difference is that for the Stylus parameters we level the mean heights for each trace and therefore calculate the deviations in one direction only. For an isotropic surface (similar in all directions) the difference from Sa may be subtle, but in other cases the difference can be enormous.
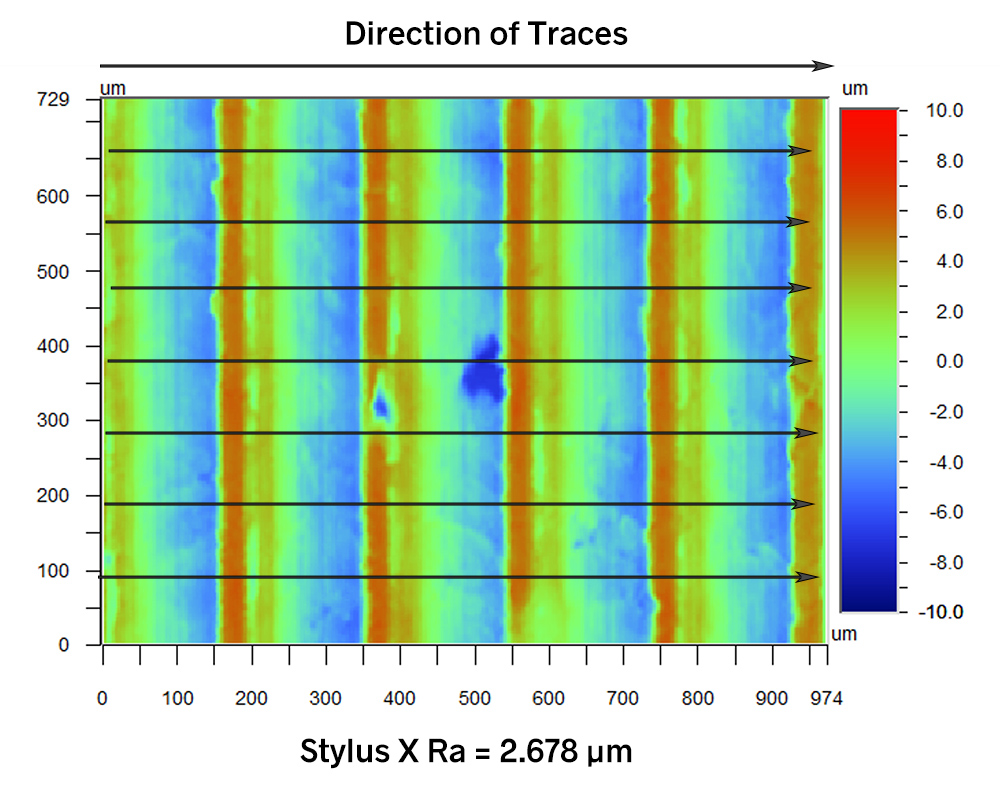
Take this turned surface as an example:
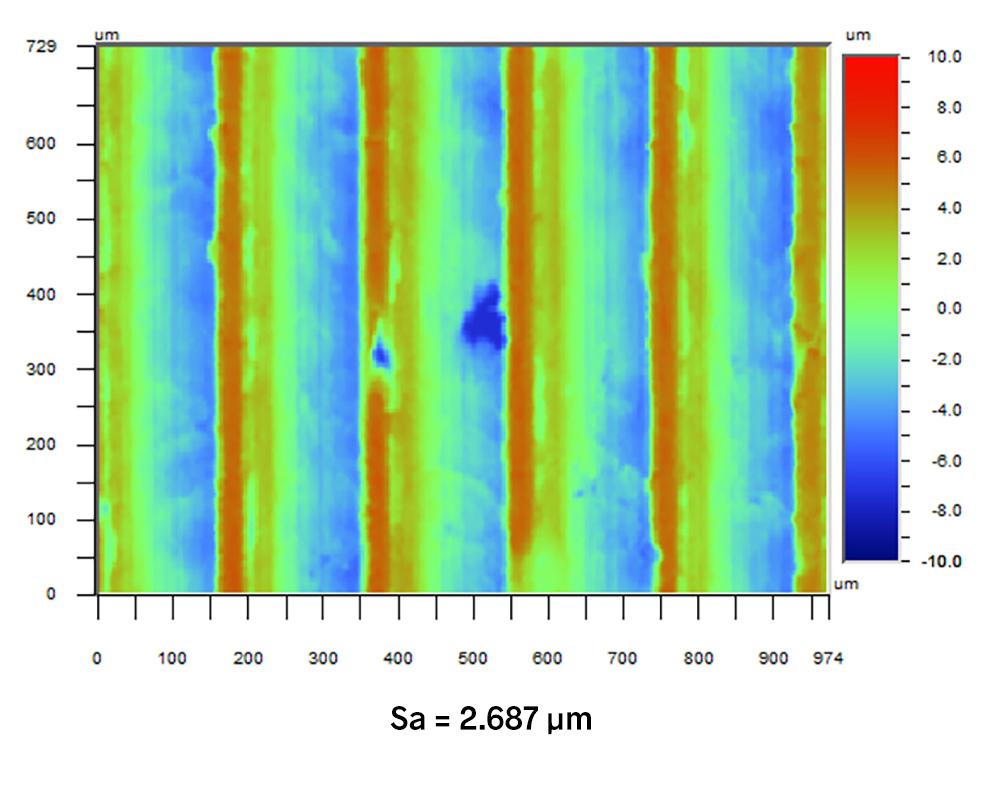
The Sa value for this surface is 2.687 µm.
If we consider a series of traces in the X direction, the turned shape is present in every trace. When we calculate Stylus Ra, therefore, the average roughness will reflect those large departures. The Stylus X Ra plot is shown below. This plot consists of all of the X traces, with their mean heights set to zero. It looks very similar to the full contour plot shown above.
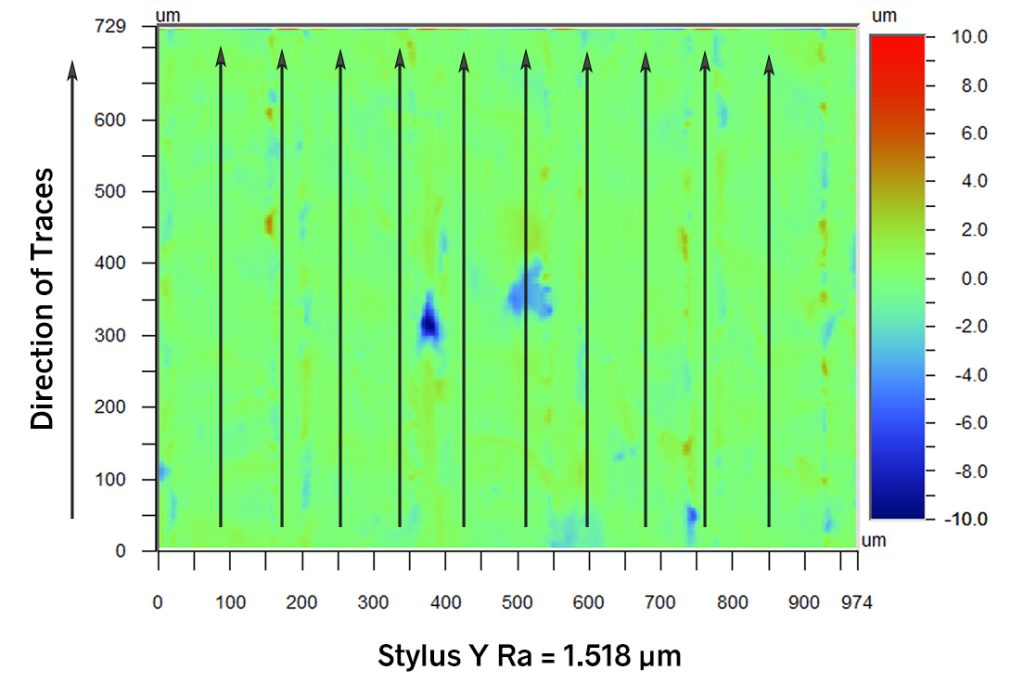
In the Y (vertical) direction, however, the heights deviate very little along any trace. When we plot Stylus Y Ra, setting the mean height of each trace to 0, the turned shape is essentially removed (the plot below). With all means set to 0, the roughness only consists of the small deviations in Y, and therefore, Stylus Y Ra is very tiny relative to Stylus X Ra:
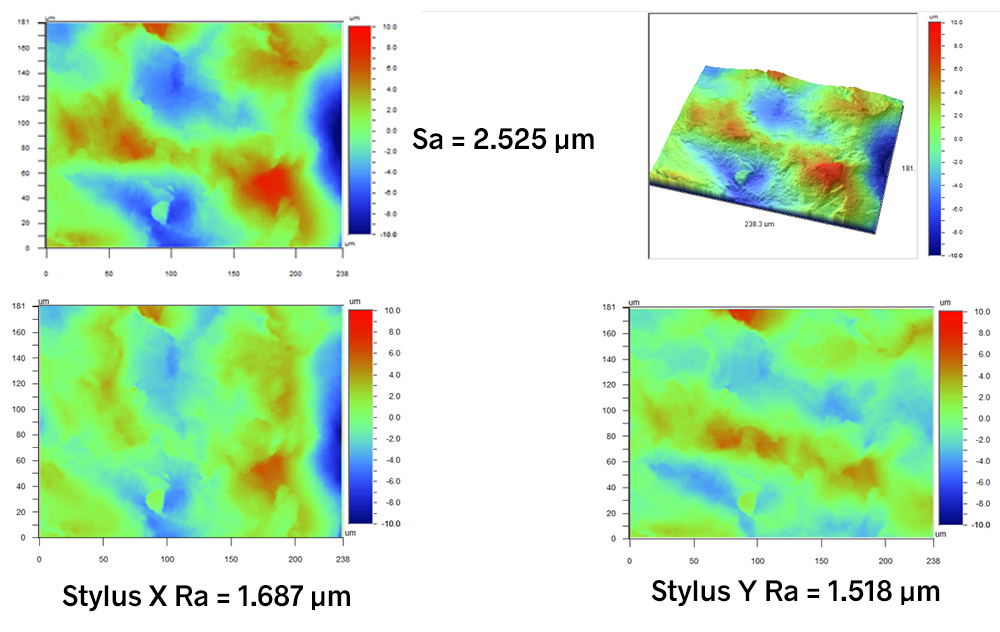
The difference is by no means only limited to special cases such as this. In the example below, the surface appears to be more isotropic than the turned surface. However, Stylus X Ra is 11% larger than Stylus Y Ra, while the Sa value is nearly twice as large! We can see in the Stylus X Ra plot that features with the largest amplitudes along X are accentuated; similarly, features with large amplitudes in Y are accentuated in the Stylus Y Ra plot.
So, can I calculate Ra from 3D data?
Most 3D software provides a “cross section” or “profile” tool that lets you select a 2D trace through the data. Ra can be calculated for this trace. However, just as it is difficult to measure an exact location of a surface twice, it’s equally difficult to specify and select the same exact trace through 3D data more than once. This error will lead to lower repeatability. Some software gives you the ability to calculate Ra based on multiple adjacent profiles, which improves the repeatability of the Ra values to an extent.
Stylus Ra parameters have their uses
Despite the fact that the Stylus Ra parameters are not directly supported by 3D texture standards, they nevertheless still have their uses. In particular, the Stylus Ra parameters provide a method to filter out a dominant structure in one axis in order to see smaller roughness features in the other direction—something no standards-supported parameters can currently do. In the turning example above, we can see some pull-outs and peaks in the Stylus Y Ra plot that would be masked by the turned shape in the contour plot. These small defects may be important for the application, and the Stylus Ra parameters provide a means to see them when they would otherwise be hidden.
Want to learn more Ra and Sa? Check out our Surface Texture and Tribology short course at udemy.com, or consider taking our next live, in-person class!
Please fill out the form below to download this article as a PDF: