3D Spatial Parameters
ACF (Autocorrelation Function)
The development of the spatial parameters involves the use of the mathematical technique of the autocorrelation function (ACF). This section will review the basic concepts behind the ACF necessary to understand the various spatial parameters.
The ACF is found by taking a duplicate surface (Z(x-Dx,y-Dy)) of the measured surface ((Z (x, y)) and mathematically multiplying the two surfaces together, with a relative lateral displacement (Dx,Dy) between the two surfaces. Once multiplied together, the resulting function is integrated and normalized to Sq, to yield a measure of the degree of overlap between the two functions. If the shifted version of the surface is identical to the original surface then the ACF is 1.00. If the shifted surface is such that all peaks align with corresponding valleys then the ACF will approach –1.00.
Thus the ACF is a measure of how similar the texture is at a given distance from the original location. If the ACF stays near 1.00 for a given amount of shift, then the texture is similar along that direction. If the ACF falls rapidly to zero along a given direction, then the surface is different and thus “uncorrelated” with the original measurement location.
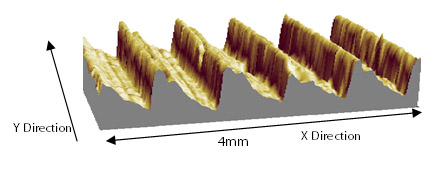
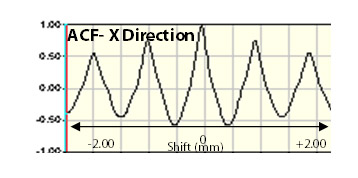
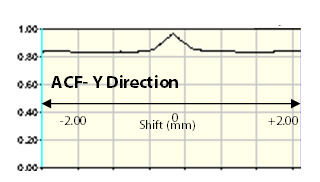
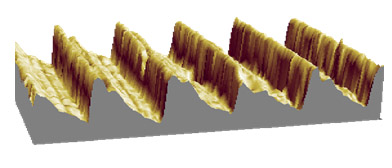
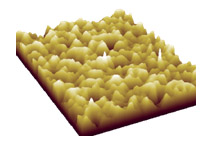
For the turned surface above, the ACF in the X direction falls to zero quickly as the peaks of the shifted surface align with the mean plane. The ACF along X becomes negative as the peaks of the surface align with the valleys of the shifted surface. Shifting along the Y direction, the surface is near identical to the original, resulting in the ACF in the Y direction remaining near 1.00.
Sal (Auto-Correlation Length) and Str (Texture Aspect Ratio)
Sal, the Auto-Correlation Length, is a measure of the distance over the surface such that the new location will have minimal correlation with the original location. The direction over the surface chosen to find Sal is the direction which yields the lowest Sal value. Str, the Texture Aspect Ratio, is a measure of the spatial isotropy or directionality of the surface texture.
For a surface with a dominant lay, the Str parameter will tend towards 0.00, whereas a spatially isotropic texture will result in a Str of 1.00.
Sal = Length of fastest decay of ACF in any direction
Str = Length of fastest decay of ACF in any direction
Length of slowest decay ACF in any direction
Application
Str is useful in determining the presence of lay in any direction. For applications where a surface is produced by multiple processes, Str may be used to detect the presence of underlying surface modifications. Str may find application in detecting subtle directionality on an otherwise isotropic texture.
Sal is a quantitative measure as to the distance along the surface by which one would find a texture that is statistically different from the original location. Sal is useful in establishing the distance between multiple measurements made on the surface to adequately determine the general texture specification of the surface. Sal may find application related to the interaction of electromagnetic radiation with the surface and also tribological characteristics such as friction and wear.
APSDF (Angular Power Spectral Density Function)
The development of the spatial parameters involves the use of the mathematical technique of the Angular Power Spectral Density Function (APSDF) This section will review the basic concepts behind the APSDF necessary to understand the Std spatial parameter.
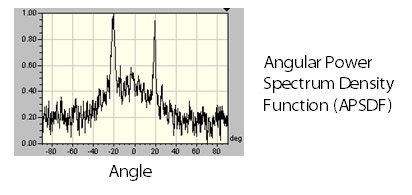
From Fourier analysis, the surface texture is composed of a series of sine waves in all directions with different spatial frequencies (i.e. 1÷ spatial wavelength) and amplitudes. The power spectrum is a measure of the amplitude of each sine wave for a particular spatial frequency, along a given direction. Thus for a 3D surface, the power spectrum would be displayed as a “3D” function in which the X and Y axes represent the various spatial frequencies for a given direction. The amplitude of the power spectrum (displayed on the Z axis) represents the amplitude of the sine wave at a particular spatial frequency direction. The angular power spectrum is found by integrating the amplitudes of each component sine wave as a function of angle. The figures below demonstrate a crosshatched surface, the power spectral density of the surface and the angular power spectral density function.
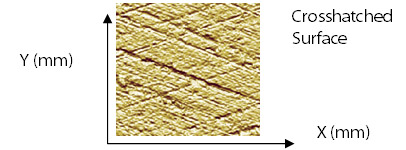
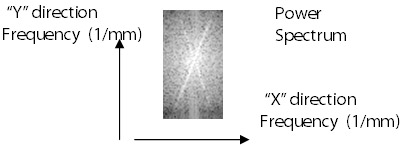
The bright regions of the power spectrum for the crosshatched surface correspond to higher amplitude sine waves at a given combination of spatial frequencies along the X / Y directions. The two dominant bright lines are thus along a direction perpendicular to the two lay patterns of the crosshatched surface. The APSDF is found by integrating the power spectrum from the center out along a given radius and displaying the relative magnitude vs. angle. The two peaks in the APSDF correspond to the large sine wave amplitudes found along directions perpendicular to the two lay patterns of the crosshatched surface.
Std (Texture Direction)
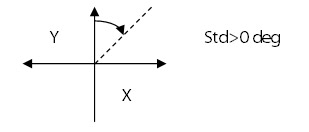
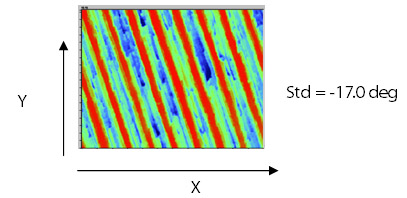
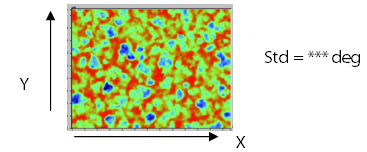
Std, the texture direction, is determined by the APSDF and is a measure of the angular direction of the dominant lay comprising a surface. Std is defined relative to the Y axis. Thus a surface with a lay along the Y axis will return a Std of 0 deg.
(Note that Std is not strictly defined in the ISO 25178-2 but was established earlier in the research which contributed to ISO 25178-2. Future sections of ISO 25178-2 may address parameters such as Std)
Std= Major direction of lay derived from APSDF
Application
Std is useful in determining the lay direction of a surface relative to a datum by positioning the part in the instrument in a known orientation. In some applications such as sealing, a subtle change in the surface texture direction may lead to adverse conditions. Std may also be used to detect the presence of a preliminary surface modification process (e.g. turning) which is to be removed by a subsequent operation (e.g. grinding followed by tumbling).