When it comes to coatings, the amount of surface area matters. We know that increasing the surface area can improve adhesion, and that “roughing up” a surface increases surface area.
But is all “roughness” equal when it comes to making coatings stick?
Surface area
Surface area impacts how well a coating will adhere, how well a liquid will wet a surface, how well ink will fill a print roller, etc. If we measure the size of the surface area, however, the result will depend on the lateral scale size of the features that we include in our measurement.
Imagine trying to measure the length of the coast of Florida. You’ll get one answer if you set out on a cruise ship and follow the shoreline. But in a smaller vessel, you could sail into every bay, so your measurement would be longer. If you swim into every cove, or step around every rock and pebble on the shore, the results would be longer yet.
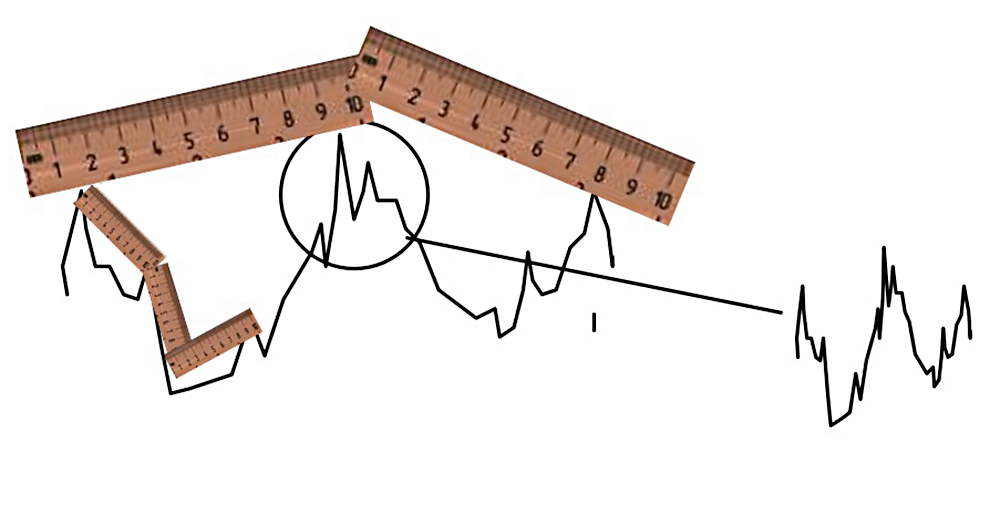
The same is true of surface area: we will get progressively larger numbers as we include smaller and smaller lateral scales (spatial wavelengths) in the analysis. For a 2D profile, like the one below, we will get different answers if we use a shorter and longer ruler. The smaller the features we include in the measurement, the longer the overall length we will measure.
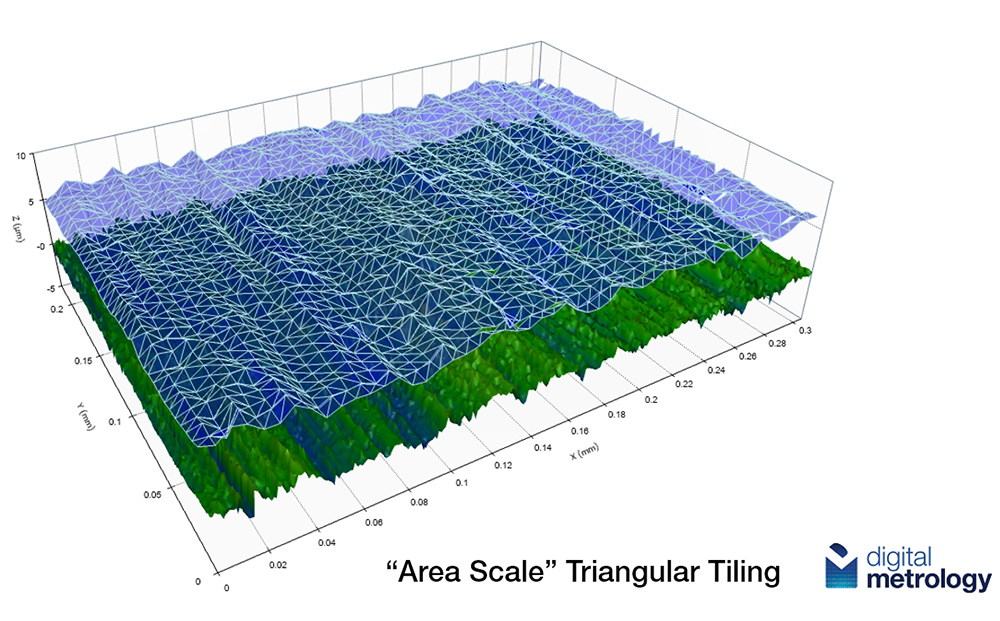
For areal (3D) data, we determine the overall surface area by “tiling” the surface with triangles, as in the image below. The smaller the tiles, the larger the surface area we will measure.
Professor Christopher Brown at Worcester Polytechnic Institute has been applying this kind of “fractal analysis” to surface measurement for last 30 years.
So, when we ask, “How big is the surface area?” the answer is, “It depends on the size of the ruler.” If we want to compare the surface area of two surfaces, we need to use the same ruler.
The Sdr parameter
For adhesion, knowing how much the surface texture increases the surface area can help predict how well a coating will stick. Basic parameters such as average roughness (Ra, Sa) can’t offer much insight, but fortunately we do have some better parameter options for the task.
Sdr, the Developed Interfacial Area Ratio, is the percentage of surface area that the texture adds to an ideally smooth and flat surface with the same cross-sectional area as the measurement region. An Sdr of 0.023% means that the texture adds 0.023% to the surface area of an ideally smooth surface.
Sdr can be calculated over a particular band of spatial wavelengths that matter for our application. We define that band by applying a short and long filter. If, say, we know that a coating is most affected by features between 0.2 µm and 2.0 µm, we can apply a 0.2 µm short filter and a 2.0 µm long filter, then calculate Sdr over just that band.
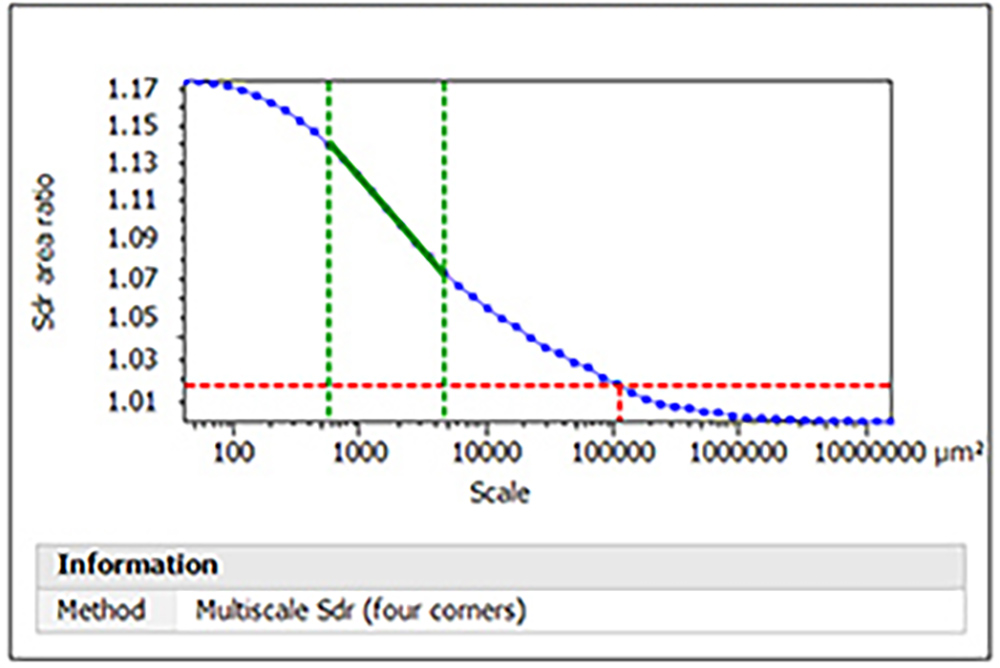
Multiscale Sdr takes this a step further by letting us plot Sdr over a spectrum of length/area scales. In the plot below, the top/left side of the graph shows Sdr when it is calculated using the smallest area scales (i.e., the smallest possible triangles) to tile the surface. Here the Sdr equals 1.17, so the texture has added 17% to the surface area! Moving right, we calculate Sdr with progressively larger length/ area scales, until we approach the ideally smooth surface on the right side of the graph and Sdr = 1.00.
Not all spatial wavelengths are equal!
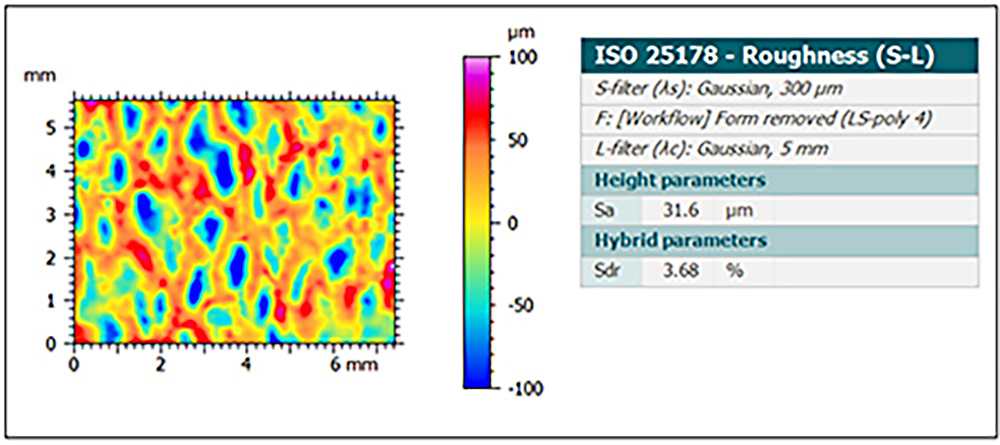
An example can illustrate when this kind of analysis is helpful. The data below shows the surface of a paper towel, as measured with a 3D optical profiler.
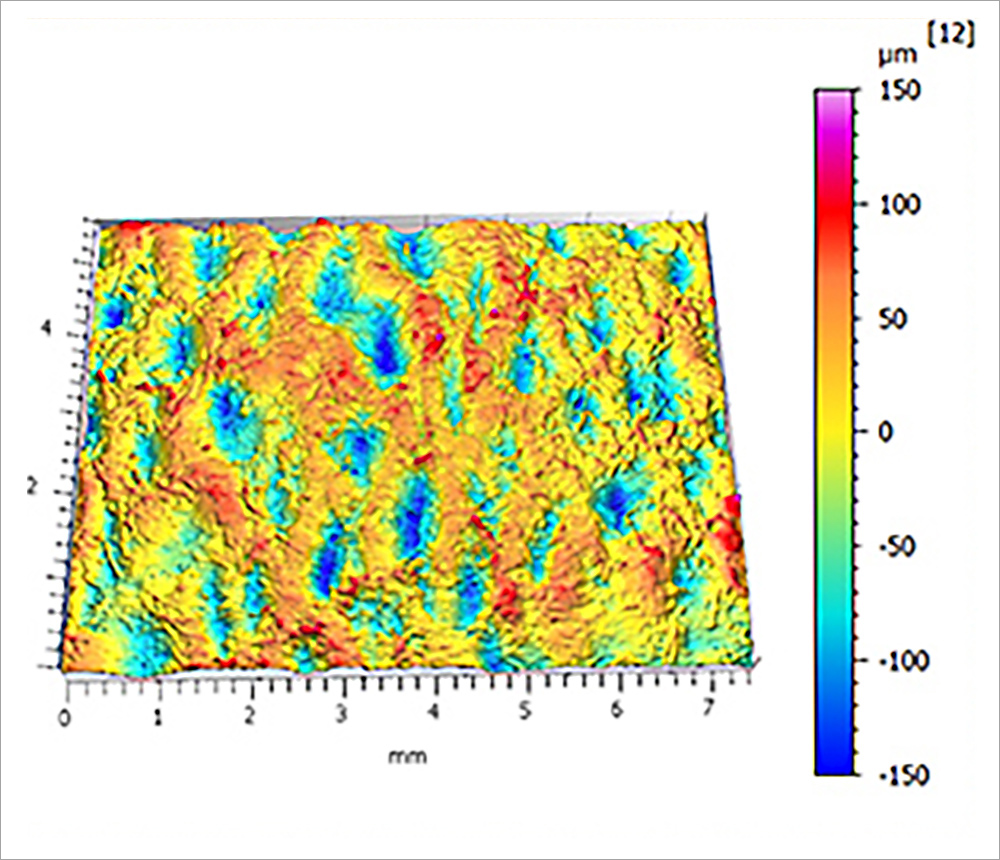
The paper surface is covered with large pores, with spatial wavelengths between 300 µm and 5mm. These wavelengths have relatively high amplitudes, with an Sa (average roughness) of 31.6 µm. It might seem that these large pores would increase the surface area, and indeed they do. The Sdr for this band of spatial wavelengths is 3.68%, So, the largest pores add a little less than 4% to the surface area.
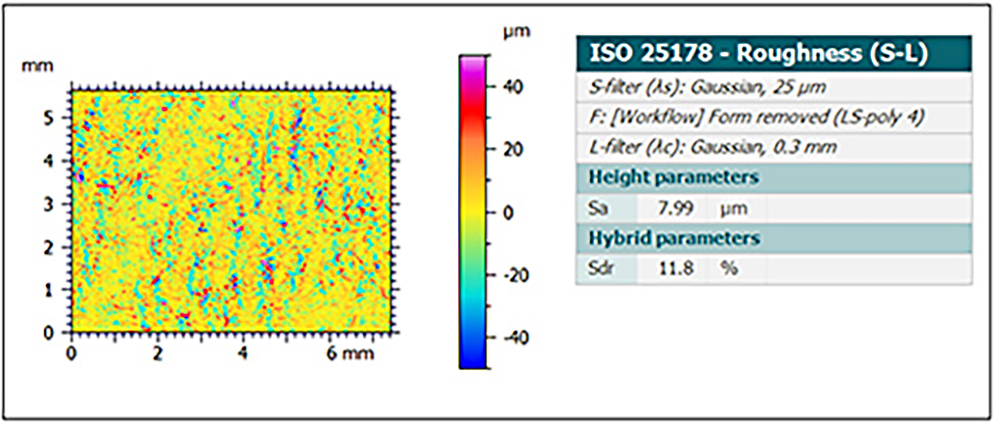
Within the larger pores, we also have smaller nooks and crannies between the paper fibers. These shorter spatial wavelength features (25–300 µm) have much lower amplitudes (Sa < 8 µm). Yet, despite their small size, these features increase the paper towel’s surface area by nearly 12%! The tiniest features increase the surface area 3 times more than the larger features.
The optimum surface texture for coating adhesion will depend on many factors, and a particular coating may bond best with particular sizes of surface features. But when it comes to increasing surface area, never underestimate the impact of the smallest features!
Want to know more about how surface texture impacts coating adhesion? Check out our upcoming Surface Roughness, Texture and Tribology class. We will be talking about this and many other aspects of surface texture.
Please fill out the form below to download this article as a PDF: