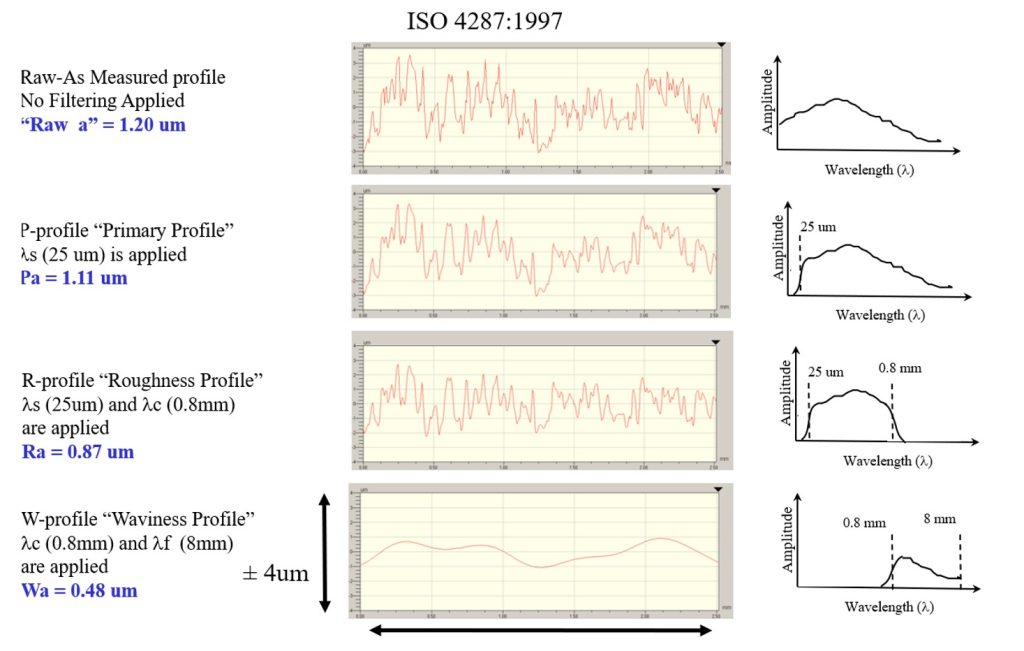
The Roughness Average, or average roughness parameter, Ra, is the average of the surface heights of every point along the “roughness profile.” Its equivalent for areal (3D) measurements is the Sa parameter. To see how Ra is affected by the cutoff, let’s start by taking a minute to define exactly what the roughness profile is.
When we take a stylus measurement, we typically remove some data from the beginning and end of the trace—parts of the trace that cannot be filtered correctly. The average of the heights of the remaining profile may be called the “raw average,” or “raw a.” This value is not Ra. We have a few more steps remaining before we arrive there.
To get to Ra we “filter” the data down to the spatial wavelengths that represent “roughness” for our application. As we’ve shown elsewhere in this blog, the range of spatial wavelengths that we will consider “roughness” is application-specific, not a universal constantroughness on a ball bearing will consist of a different spatial wavelength range than, say, roughness on a casting, or roughness on a road surface.
Our first filter is a “short cutoff” to remove the shortest spatial wavelengths, which are beyond the resolution of the instrument. The data that remains is known as the “primary profile,” and the average height of these points is the “primary average,” or Pa.
The next operation is to apply the “roughness cutoff,” which divides the “roughness” spatial wavelengths from the longer-spatial wavelengths that we will call “waviness.” The result is two sets of data called the “roughness profile” and “waviness profile.” Their averages are the roughness average (Ra) and waviness average (Wa), respectively.
The filtering process described above (and defined in the ISO 4287:1997 standard) is shown below.
Now, back to our original question. The wavelength of the roughness cutoff is the “cutoff wavelength,” often simply referred to as the “cutoff,” and represented by λc. The choice of the cutoff wavelength will greatly impact the resulting Ra. As an example, in the image below we show the same data analyzed using cutoff wavelengths of 2.5, 0.8, 0.25 and 0.08 mm, respectively. The reported Ra values range from 11.8 µm to just 1.4 µm…almost a ten-fold difference, but the same measurement data! It’s important to note that the part was not remeasured…only the analysis settings in the software were changed!
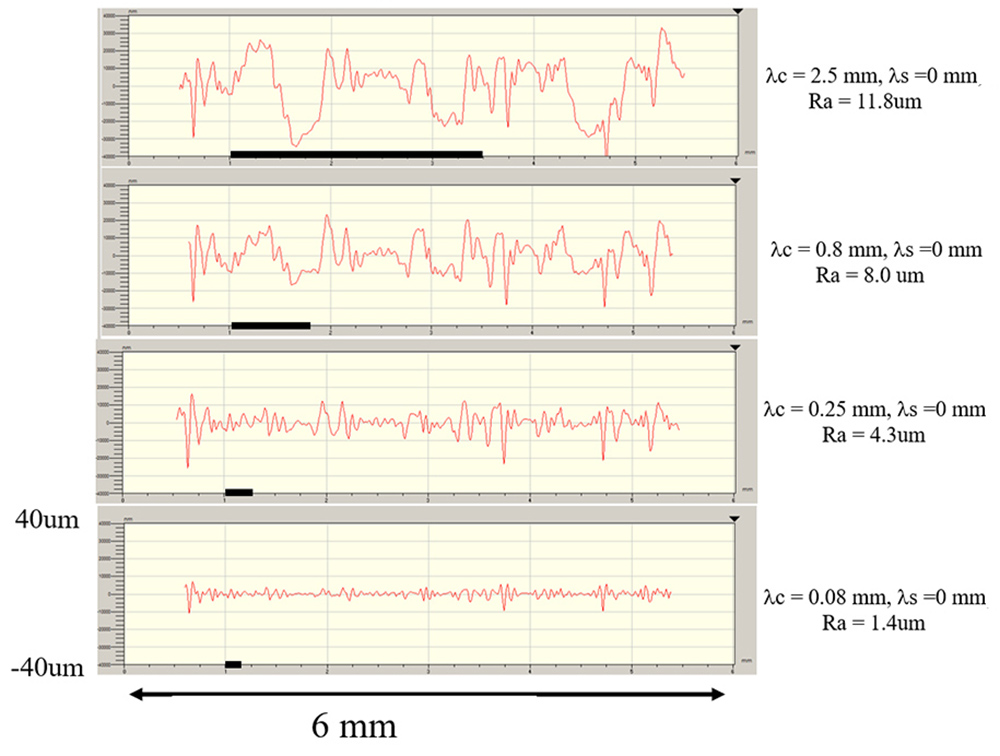
We can see from this example that reporting an Ra value without specifying the cutoff wavelength used to measure is essentially meaningless.
Because Ra, and many other parameters, are dependent upon the cutoff wavelength, it is imperative that the cutoff be specified on drawings, along with the parameter (e.g., Ra) values. The procedure for specifying a cutoff, and what to do if the cutoff has not been properly specified, are topics that we cover in depth in the Filtering module from our Surface Texture and Tribology short course, available on udemy.com. I highly encourage you to download and review this information—it’s critical to surface texture analysis, and, when handled incorrectly, has been the source of many quality and warranty issues over the years!