A few months ago, in our post on the “real area of contact,” we included Frank Phillip Bowden’s famous quote that surface texture is rather “like turning Switzerland upside down and standing it on Austria.” His point was that two surfaces in contact are actually only “in contact” at a small percentage of points over the entire, perceived area of contact.
Unfortunately, that quote, coupled with the output of most surface roughness software, has led a generation of measurement professionals to envision precision surfaces as tiny, sharp mountain ranges grinding away at one another.
The vertical scale of most surface roughness data is highly exaggerated so that the detail can be more readily discerned. In reality, the actual slopes are fairly gradual. At 1:1 scale most surface texture features are gradual enough that a 90-degree stylus measurement probe can easily trace them.
“A slope of 1 degree is almost imperceptible to the human eye,” wrote Tom Thomas in his book, Rough Surfaces.1 “The instrument manufacturers have therefore found it convenient to exaggerate the vertical magnification over the horizontal on their chart recorders,” he continued. “The contact of two rough surfaces, far from resembling Bowden’s famous analogy of ‘Austria turned upside down on top of Switzerland’ (Bowden and Tabor 1950) more closely resembles Iowa on top of the Netherlands (Thomas 1973).”
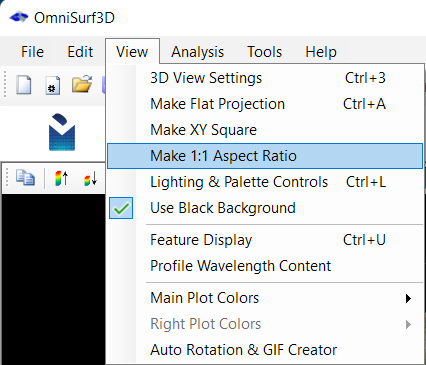
Some software makes it easier than others to view data at 1:1 scale. Digital Metrology’s OmniSurf3D, for example, includes a “Make 1:1 Aspect Ratio” option:
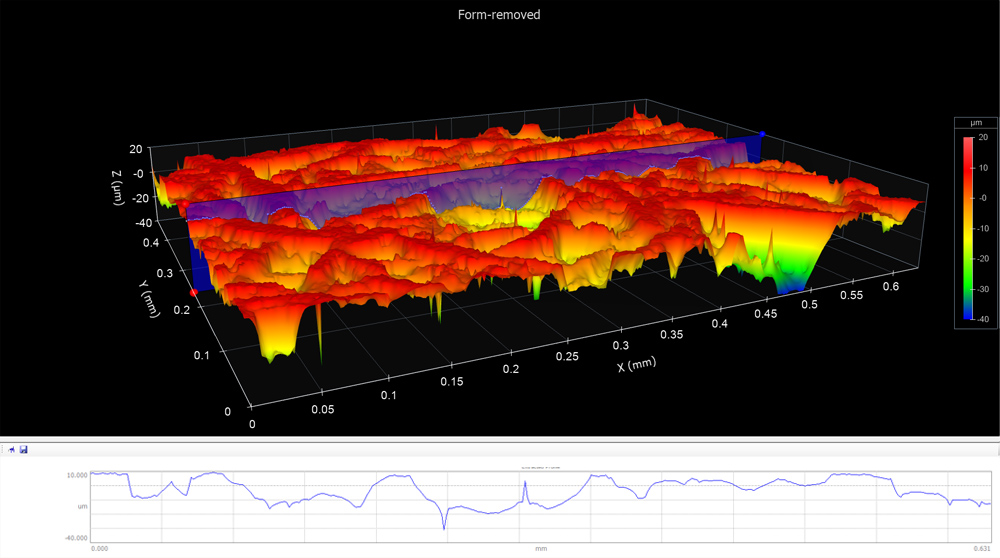
Here is a 3D surface map of a clutch friction plate, displayed at a typical scaling…
…and again at 1:1 scaling:
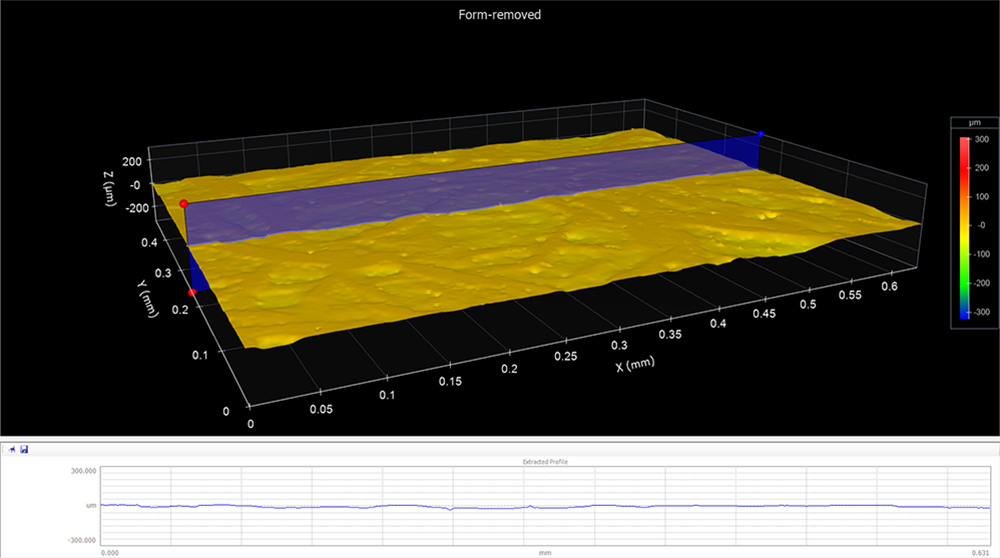
These images are courtesy of OmniSurf3D software (Digital Metrology Solutions).
Auto-Scaling
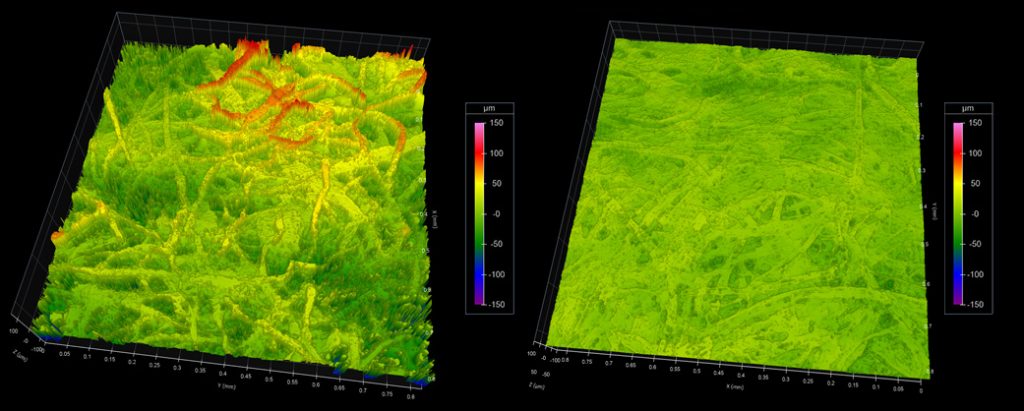
Another possible cause of misinterpretation can be the “auto-scale” function included—and often automatically enabled—in most software. Auto-scaling uses the full range of display values (heights in 2D data, colors in areal 3D data) to represent the surface features. Typically, we want to use the full range of values to make the features easily discernable. Problems can arise, however, when we try to compare surfaces. Take the two surfaces below:
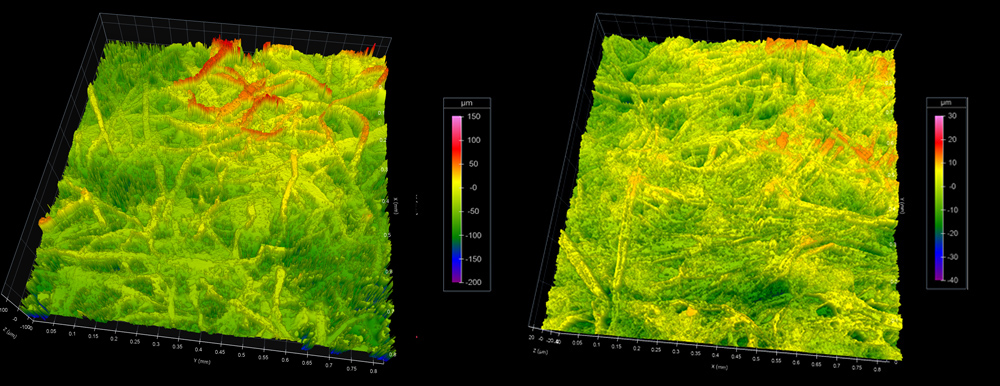
Because the datasets have been auto-scaled, the two surfaces appear to be essentially equivalent. In reality, however, the image on the left is household tissue paper, with an average roughness (Sa) of ~25µm, while the image on the right is printer paper, with an Sa of only ~3µm — almost a 10X difference in roughness! That significant difference is almost entirely lost due to the scaling: on the left the full vertical scale is -100–100 µm, while the full scale for the image on the right is -40–30 µm.
By turning off auto-scaling, and assigning the same vertical scales to both datasets (-100–100µm), we get a much clearer comparison of the two surfaces:
These datasets are available in Digital Metrology’s Surface Library, if you are interested in trying this out for yourself.
Learn more about scaling in the Filtering for Roughness, Waviness, and Form module of our Surface Roughness, Texture and Tribology short course, available online at udemy.com.
1. Thomas, T. (1998). Rough Surfaces, 2nd Edition (2nd ed.). World Scientific Publishing Company. Retrieved from https://www.perlego.com/book/850529/rough-surfaces-2nd-edition-pdf (Original work published 1998)