I have a surface with a certain average roughness value. When I polish the surface, it gets shinier…but the measured number hasn’t changed! What’s going on?
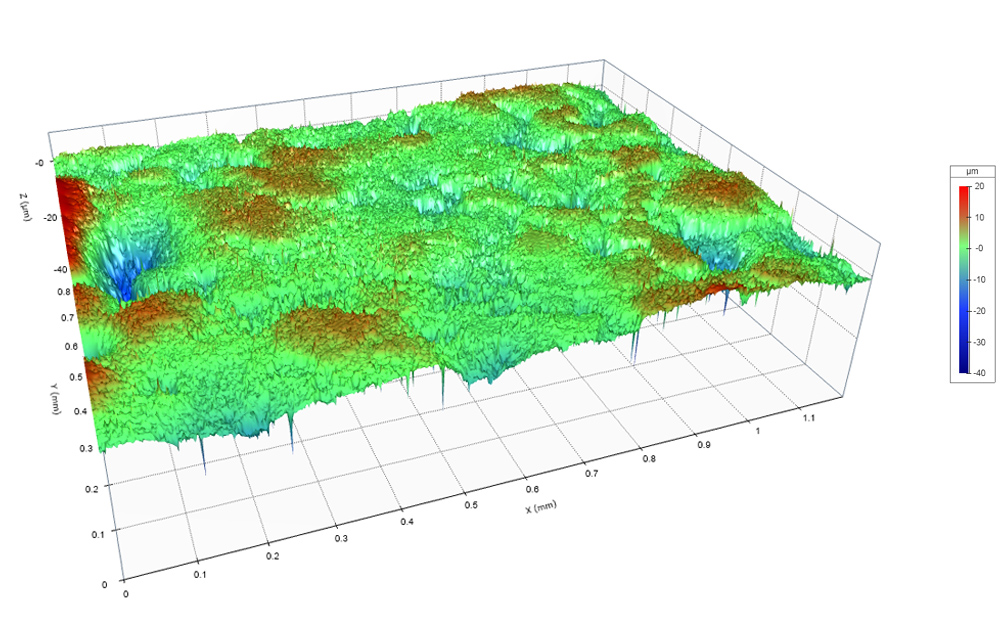
Here’s an example to illustrate what’s happening. This plated surface has a matte finish. The value for Sa (the arithmetic mean height, or “average roughness”) of the surface is 2.115 µm.

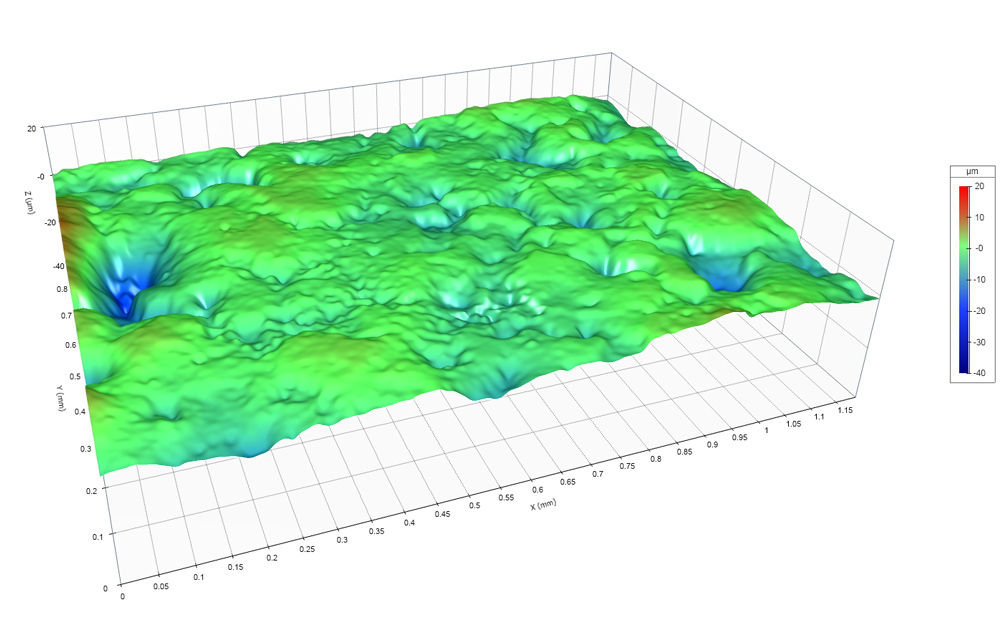
After polishing, the surface has a near-mirror finish…yet the Sa value has barely changed: 2.034 µm.

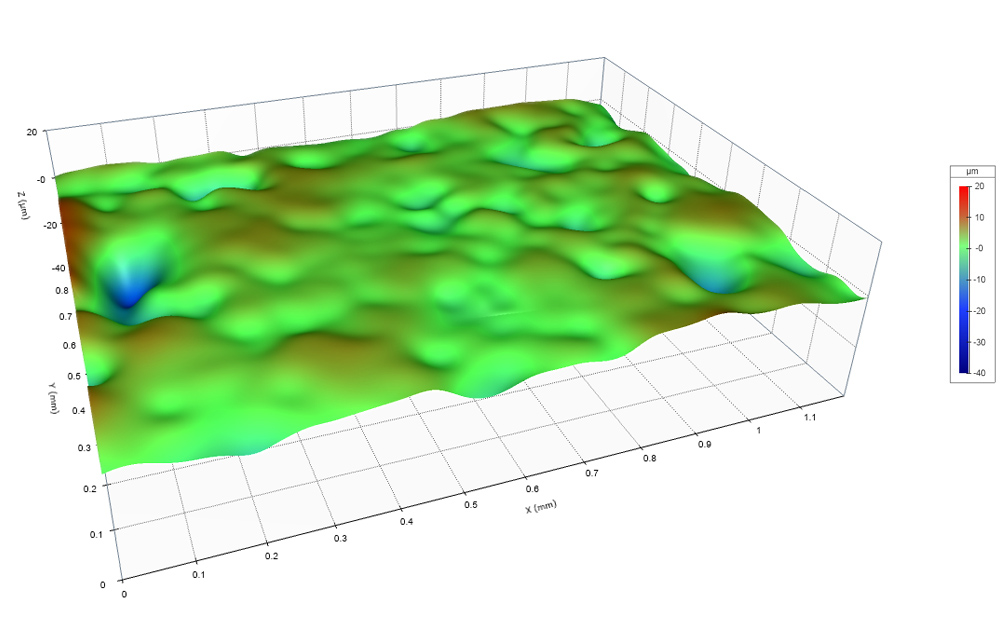
The issue is that this surface is composed of very short spatial wavelengths, which matte the finish. But it also consists of long spatial wavelengths, which tend to have larger amplitudes than the shorter wavelengths.

When we polished the surface, we removed the short spatial wavelengths by plastic deformation, making the surface appear shinier. But we barely impacted the long spatial wavelengths—and the amplitudes of those longer wavelengths dominate the value for Sa. It’s like mowing the grass on a mountain: If you measure the height of the mountain plus grass, that number is not going to change very much after mowing!
Choose the spatial wavelengths for the application
We need to be sure that we are measuring the spatial wavelengths that matter for our application. For this surface, if appearance matters, then we need to base our measurement parameters on those short spatial wavelengths that our eyes respond to. To be able to see them, we need to filter out the longer spatial wavelengths that mask the differences that we care about.
Choose more than one set of spatial wavelengths if need be
That said, the longer spatial wavelengths might also be important for the application. Significant long-wavelength content in a bearing surface, say, could be a source of noise, chatter, or premature wear. If we only measure the short spatial wavelengths, those longer spatial waves might easily go unnoticed. It may be necessary to analyze those longer waves separately in order to get a complete picture of the surface.
Try a different parameter
We might also choose to look at a different parameter than Sa. Sdq, for example, is a general measurement of the slopes that make up the surface. Since Sdq is sensitive to “peaky” material with steep slopes, it can often differentiate surfaces that have similar Sa values. In our example, the Sdq dropped from 22.441° to 7.563° after polishing…while at the same time, Sa barely changed! Sdq, in this case, is responsive to the same kinds of texture that our eyes perceive.
As always, the decision as to which parameters to measure, and which spatial wavelengths to measure them over, depends on the application. If what you are seeing doesn’t match the numerical results you are measuring, your eyes may not be playing tricks on you. It very well might be that you need to adjust the spatial wavelengths that are being measured.
Please fill out the form below to download this article as a PDF:
