Lighting and automotive lighting applications require more complex lens shapes and textures. To support these high-performance designs, manufacturers are pushing the boundaries of plastics, and the molds required to make them.
The designs for lighting applications are typically developed using optical ray-tracing software, which can indicate both the shape and finishes required to produce the desired output. But moving those designs to production is no easy task, and specifying, prototyping, and reproducing those complex shapes and finishes is often more art than science at this point.
Specifying finish for optical quality
In mold making, surface finishes are often specified according to qualitative samples on a comparator standard, such as the one below:
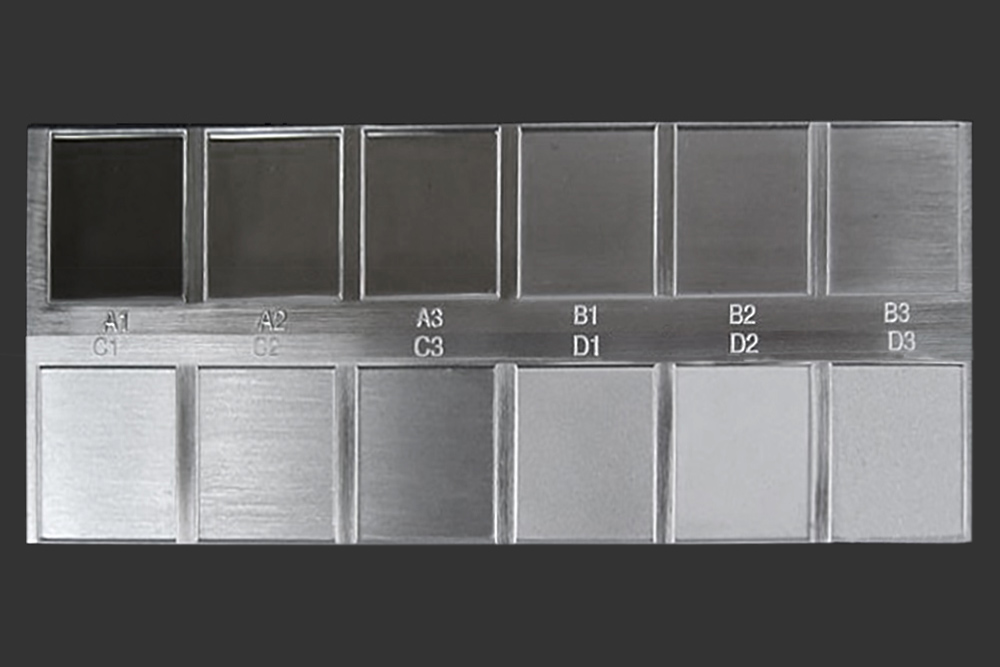
This approach is often sufficient for general use plastics. But these samples do not provide specific enough information to recreate the complex surfaces required for lighting applications. They were not designed to control how light scatters!
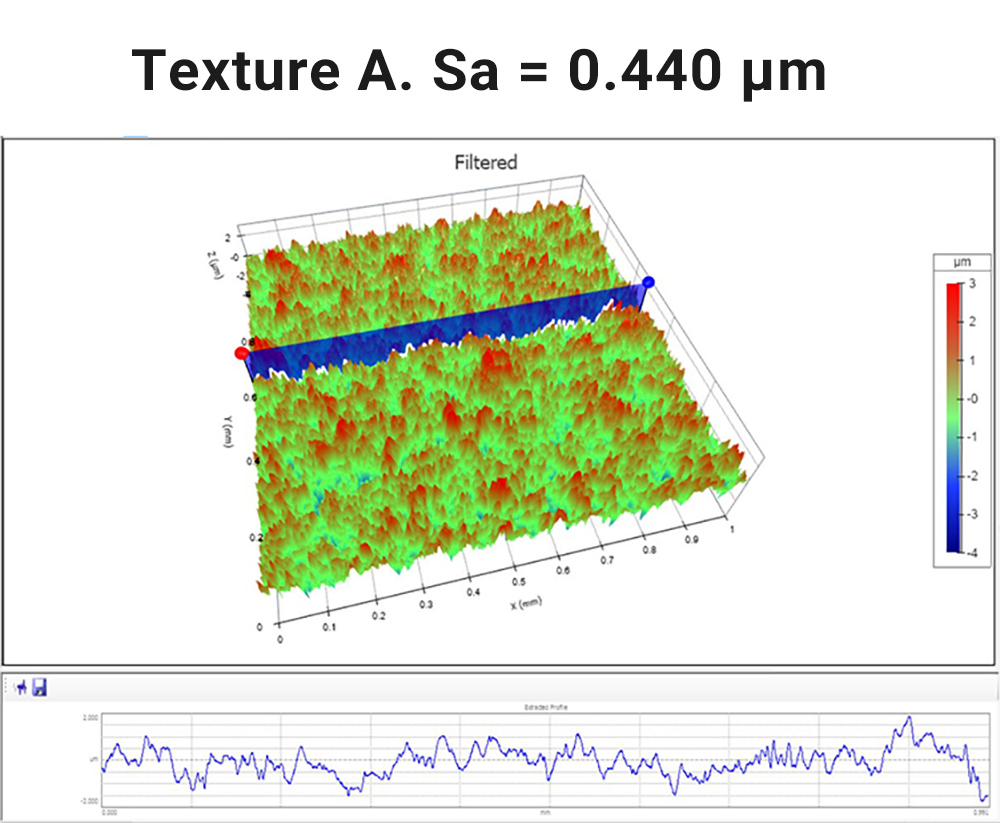
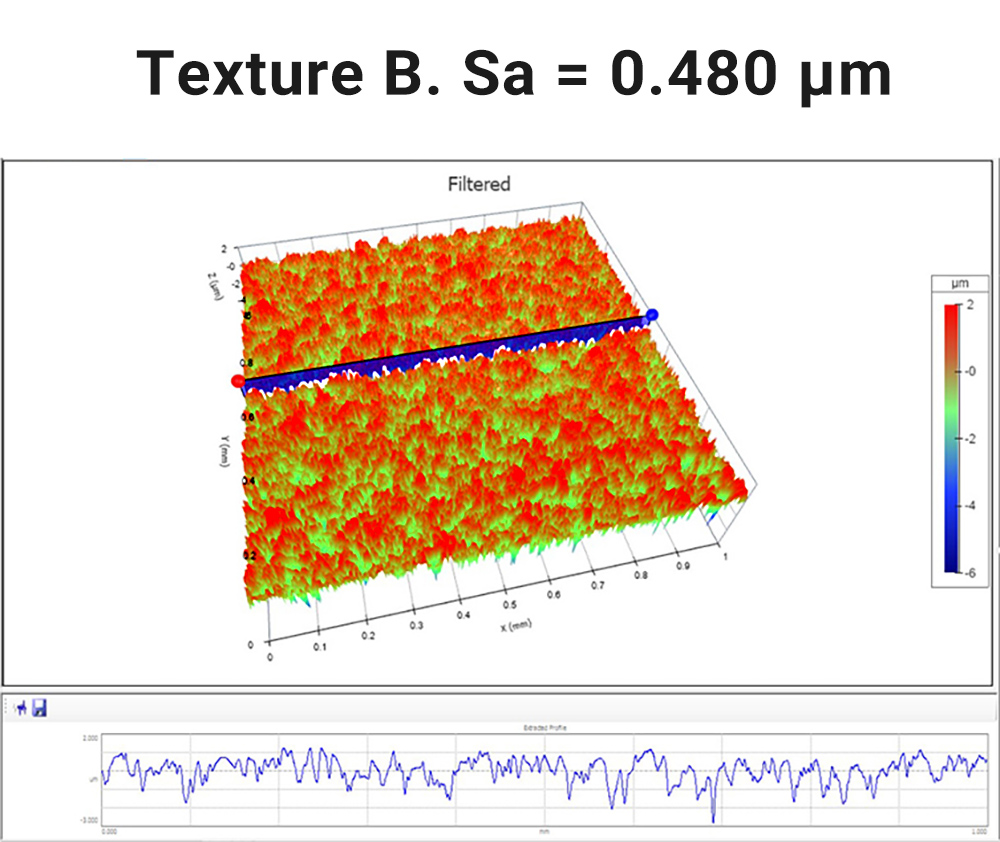
Other “standards” are available that are more suited to applications in lighting. They typically include physical examples of surfaces, along with standard roughness parameters such as average roughness (Ra), and potentially some custom parameters which may or may not appear in standards. While these have more utility than general surface finish samples, they still do not provide enough information to control a surface. The two textures below have very similar Ra values, yet Texture A was “clearer” or “translucent,” while Texture B was visibly “hazy” or “matte.”
What questions should you ask when specifying finish?
Specifying surface finish for lighting is similar to specifying any other surfaces. We need to focus on what’s important for the particular application:
- Which aspects of the surface do we need to emulate to get the same illumination outcomes?
- Which aspects of the surface need to be consistent in order to achieve the quality goals?
- Which aspects of the surface can help distinguish “good” from “bad” parts?
In the example textures above, the finish of Texture B was found to produce more uniform light. But measuring Ra across the entire spectrum of spatial wavelengths could not differentiate a “good” (sufficiently matte) texture from “bad.” We’d need different controls to control the processes and to accept/reject parts.
What kinds of controls might do a better job?
While Ra measured over the entire spatial wavelength spectrum was not a good indicator, Ra measured over a narrow band of shorter spatial wavelengths might be more informative. If we know the spatial wavelengths that scatter the light the way we want, then measuring the amplitude (Ra) over that wavelength range may tell us what we need to know.
The slopes within the texture may be of even greater importance than the amplitude. The Sdq parameter provides a general measure of surface slopes and can often differentiate surfaces that have similar Ra values, like the two we introduced above.
The surface area (Sdr) and surface uniformity (Str) can also be useful for describing surfaces in lighting applications.
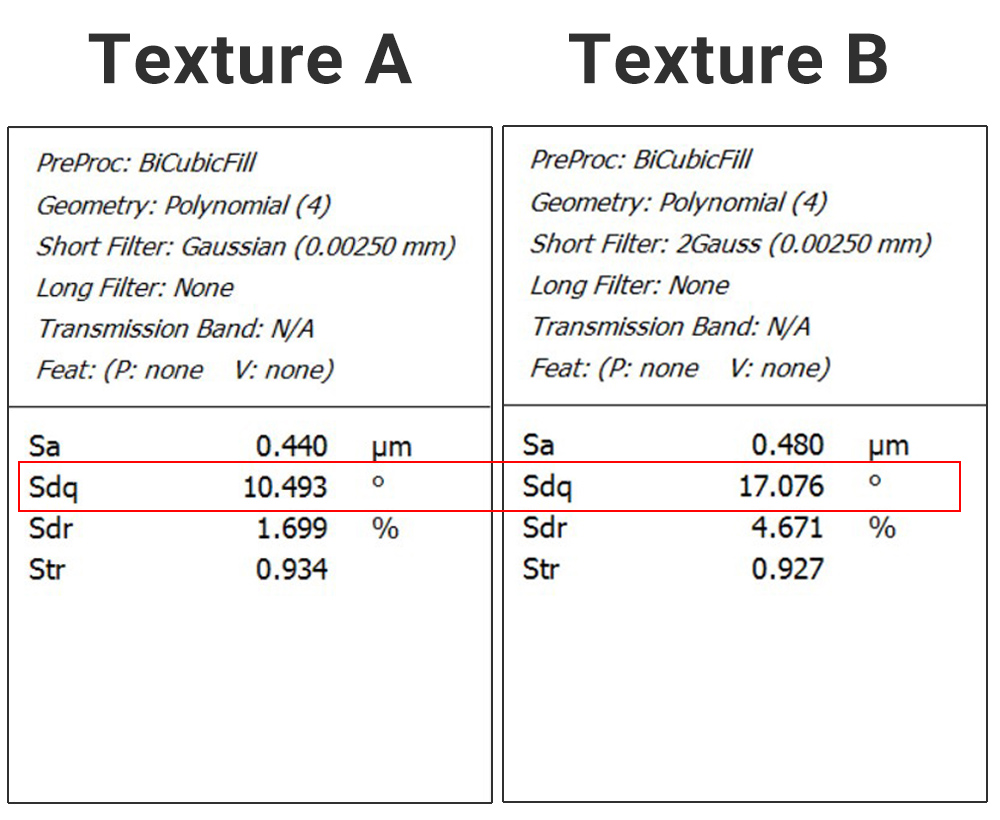
The Sdq parameter can differentiate the two textures that have similar Ra values.
The power spectral density (PSD) plot can also be useful. PSD indicates the power present at all spatial wavelengths, from longer spatial wavelengths in the center to shorter wavelengths at the edges. The highest amplitudes/power are shown in red. The PSD for Texture A (below) shows the highest amplitudes/power at the very center (i.e., the longer spatial wavelengths).
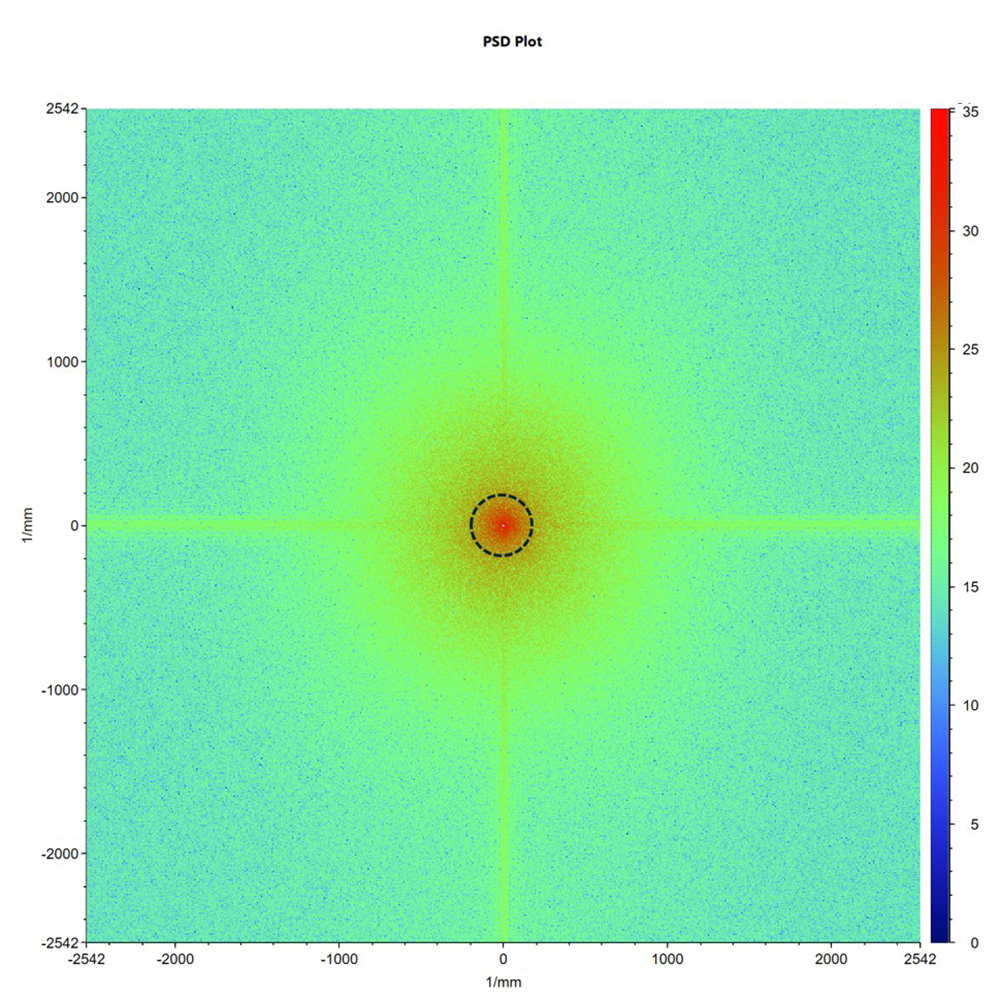
The Power Spectral Density (PSD) plot for Texture A shows less scattering.
The PSD for Texture B (below) shows higher amplitudes/power at shorter spatial wavelengths, further away from the center. The higher power in these shorter wavelengths will lead to a greater degree of scattering.
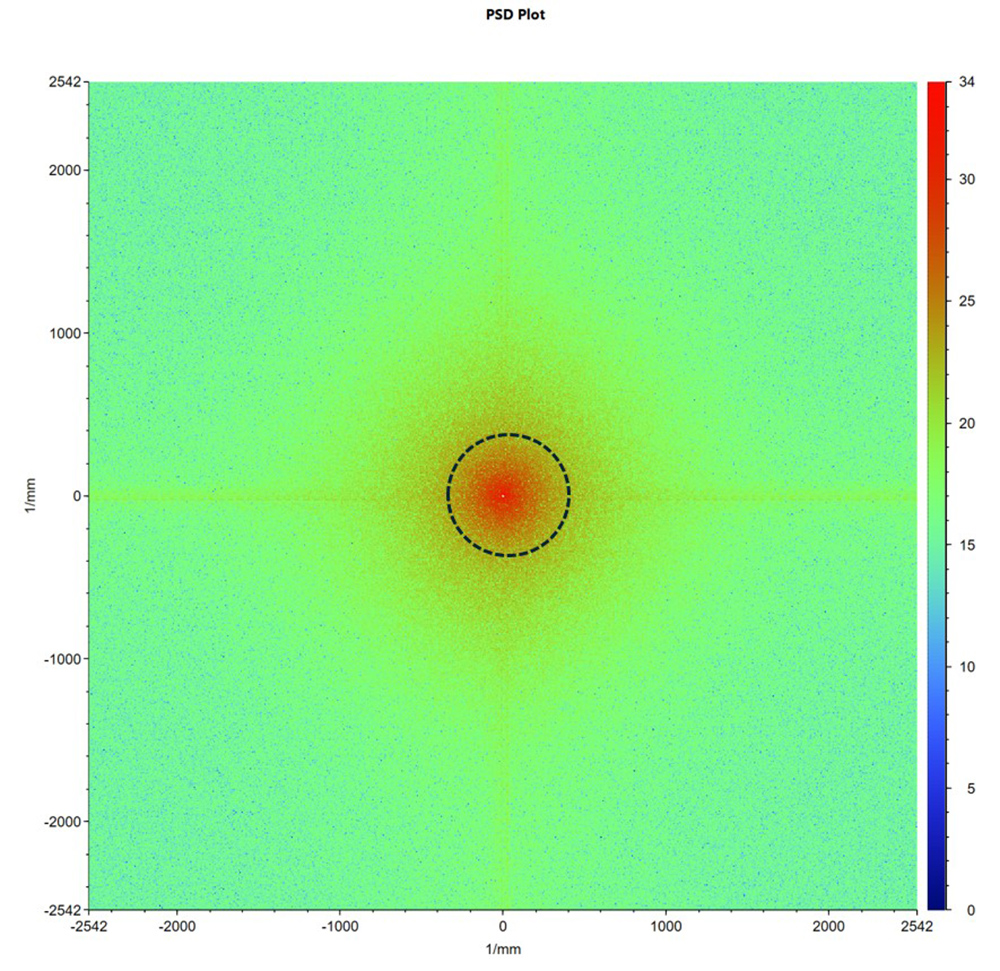
The Power Spectral Density (PSD) plot for Texture B shows higher power at shorter spatial wavelengths (shown in red, further from the center).
The “holy grail?”
Ultimately, the most accurate way to reproduce a “good” surface would be to acquire a high-resolution point cloud for the known good surface, then load that data into ray tracing software to understand how light passes through or reflects off the surface. The point cloud could even, potentially, be used as a source file to manufacture clones of the surface!
Got questions? Give us a call
Determining how to specify and inspect parts for lighting begins with having the data to tell good from bad parts. Michigan Metrology has over 30 years of experience with 3D optical profilers, which provide the high resolution, large field measurements We routinely measure plastic and optical components for a wide range of applications, including lighting and automotive.
Call us today to discuss your lighting application—we’d be happy to help!