When surfaces move against each in contact, we need to understand how the surfaces interact, how much friction is involved, and how they will wear in response to the contact. Applications include sliding or rolling components, engine parts, electrical contacts, heat sinks, gears, etc.
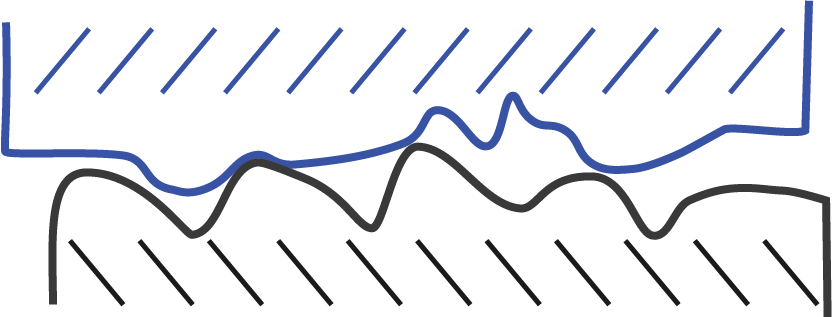
Key to understanding how the surfaces interact is to have a good picture of the “real area of contact” between the two surfaces. We know that when surfaces are in contact not all points are in contact:
Therefore, we need parameters that can describe how much of the surfaces actually are touching, and the shape of those areas that are making contact. We can then track that data across time as the two surfaces wear.
Two useful parameters in this endeavor are Sds (the Summit Density), which counts the number of summits per unit area of the surface, and Ssc (the Mean Summit Curvature) which is an indicator of the shape and size of the higher areas of a surface.
Ssc and Sds are known as “hybrid” parameters and also “feature” parameters, which treat a surface as a series of features rather than a single surface of generalized roughness. These types of parameters give us tools to consider the size, shape and nature of the individual summits rather than thinking in terms of overall surface properties.
Ssc and Sds are extremely useful parameters for predicting the degree of elastic and plastic deformation of a surface under different loading conditions. They may be used in predicting friction, wear and real area of contact for thermal/electrical applications.
Calculating Sds and Ssc
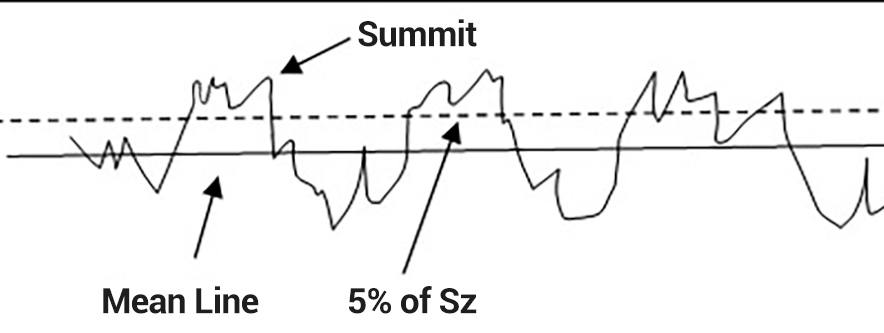
To calculate Sds we find the number of “summits” per unit area of the surface. The summits are derived from “peaks,” which are defined as any point that is higher than all 8 of its nearest neighbors. When we calculate Sds we consolidate closely spaced peaks into a single summit. We also only include summits that exceed a height threshold above the mean plane (i.e., only summits that are likely to contact a mating surface). These constraints help remove noise and outliers so that we have a more repeatable measure of the density of high areas of the surface.
We calculate Ssc as follows:
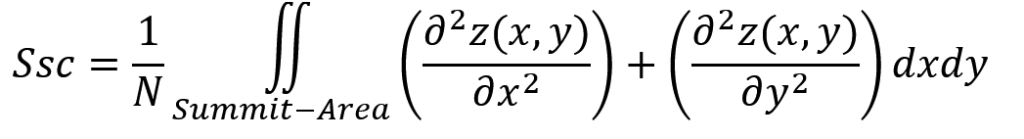
It is first evaluated for each summit, then averaged over the entire area.
Interpreting Ssc Values
Ssc is the inverse of the radius of the summits (Ssc = 1/r), giving us a sense of the size of the individual peaks. A large Ssc indicates small, needle-like summits, which will provide a smaller area of contact and possibly lower friction (assuming elastic deformation). However, these structures may not be sturdy and may crush (i.e., plastically deform) during initial contact, resulting in some degree of wear, and higher friction after a period of contact. If the Ssc is high (i.e., small radii) and the material is hard, the sample may abrade/cut a softer mating surface, again leading to higher friction and wear.
A small Ssc indicates structures with larger radii, which can support the contact load elastically. Think of a field of mushrooms as a surface with a small Ssc.
The application dictates the Ssc value that is required for optimal function. For an electrical contact, for example, we may want a surface with a high Ssc, predominated by spikes that can penetrate the oxide layer which may build up over time. A low Ssc surface may provide better long term wear on parts that undergo large loading forces.
An Example of Ssc
An example case, let’s say we are evaluating a coating for a reciprocating engine component.
The wear motion would be similar to the image below, with the bottom surface fixed while the top surface slides back and forth.
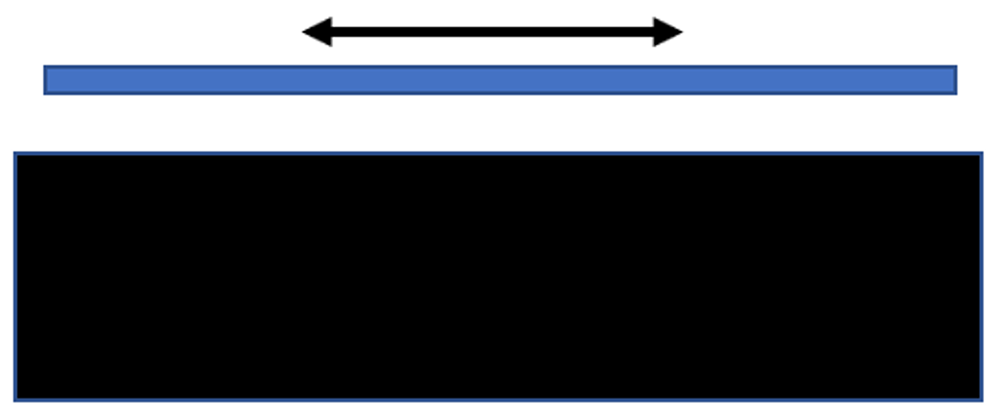
We can assess the coating by comparing uncoated and coated surfaces when the parts are new, and again after a period of wear (or a period of accelerated wear.
But how will we compare the surfaces? We might decide to look at the Sa (Average Roughness) of the surfaces over time. But, as we will show, Ssc and Sds can provide us with better tools for comparison.
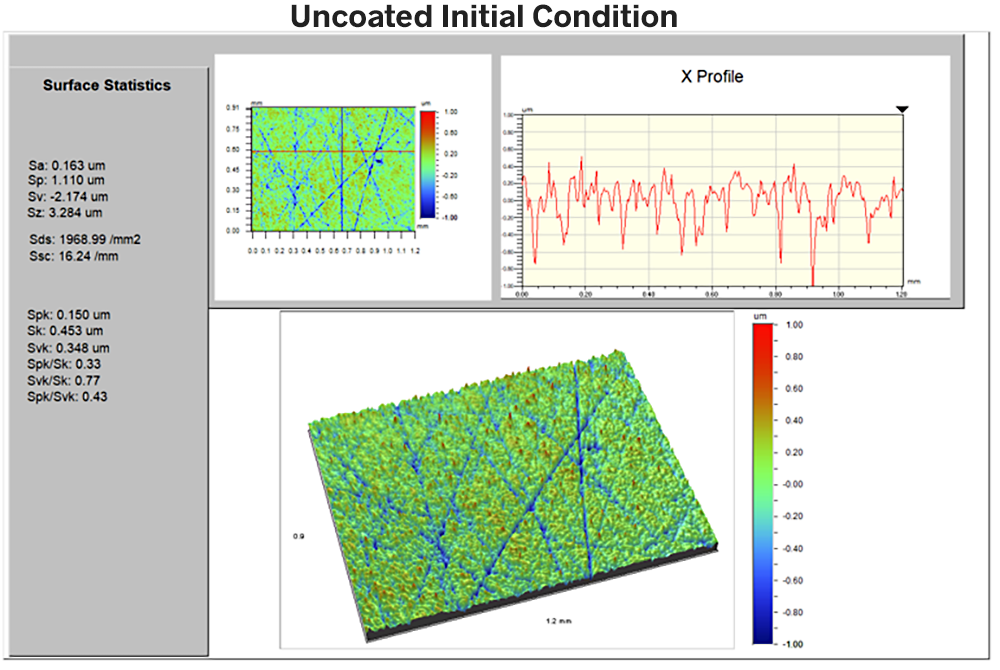
First, let’s look at the uncoated sample. An optical 3D profiler gives us a high resolution measurement of a 0.9 x 1.2mm area of the surface. Using the analysis software included with the instrument we determine that Sa = 163nm, Ssc = 16mm-1 and Sds = 1968mm-2.
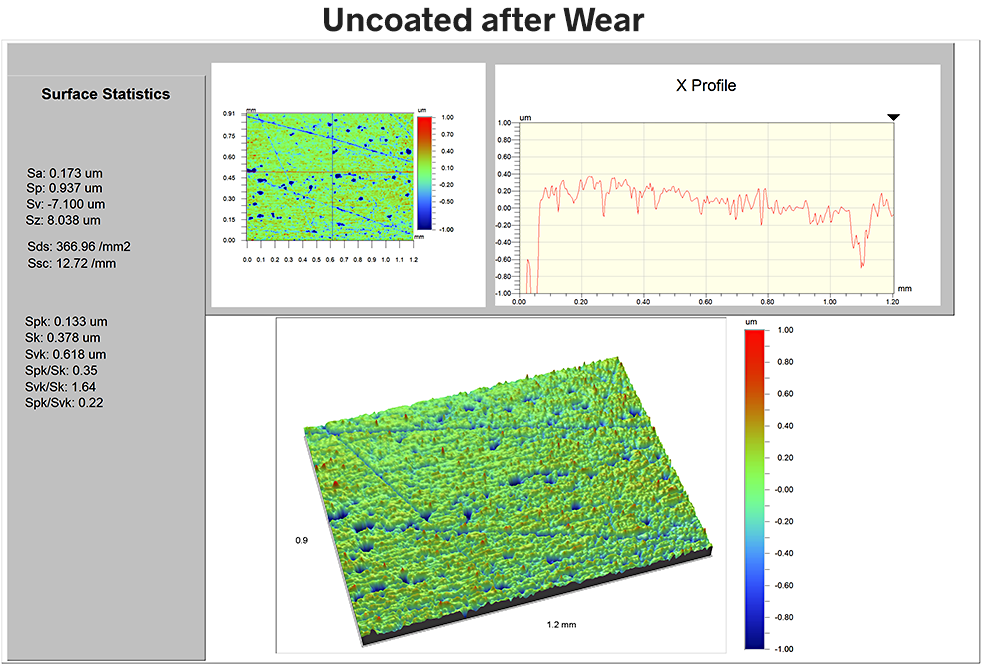
After a period of wear we again examine the surface:
The Sa value is now 173nm—the roughness has increased by 10nm over the initial state. Ssc has dropped to 13mm-1 as the smaller radii structures plastically deformed, leaving only the larger radii (i.e., smaller Ssc) structures.
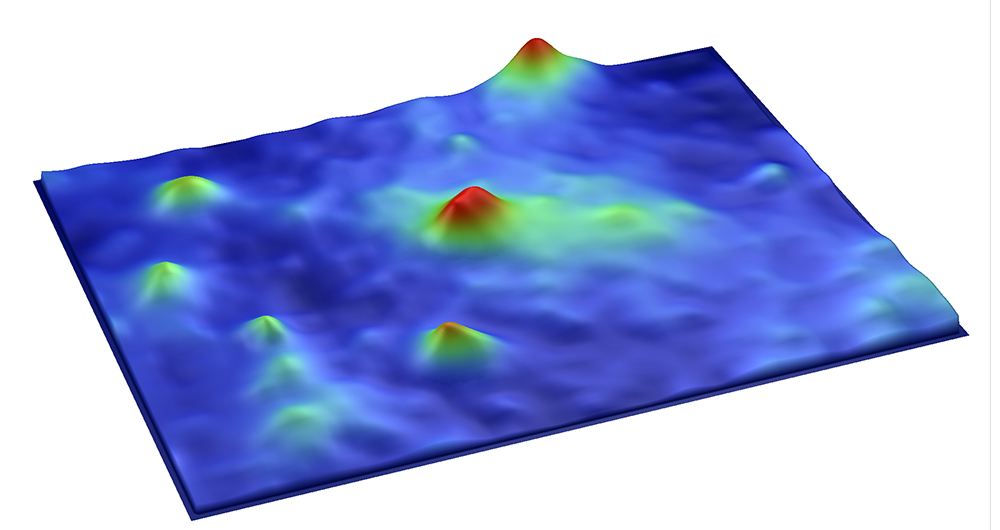
But the most dramatic change is in the Sds, which has dropped from 1968 to 370/mm-2. The effect is clear in the 3D data image: the surface has change from a fairly uniform field of similar-height summits to a pitted surface with scratches in the direction of sliding.
Now we’ll do the same before-and-after comparison for the coated sample. We would expect that if the coating is effective then the surface should resist this kind of wear we saw above. Here is the coated sample, initially:
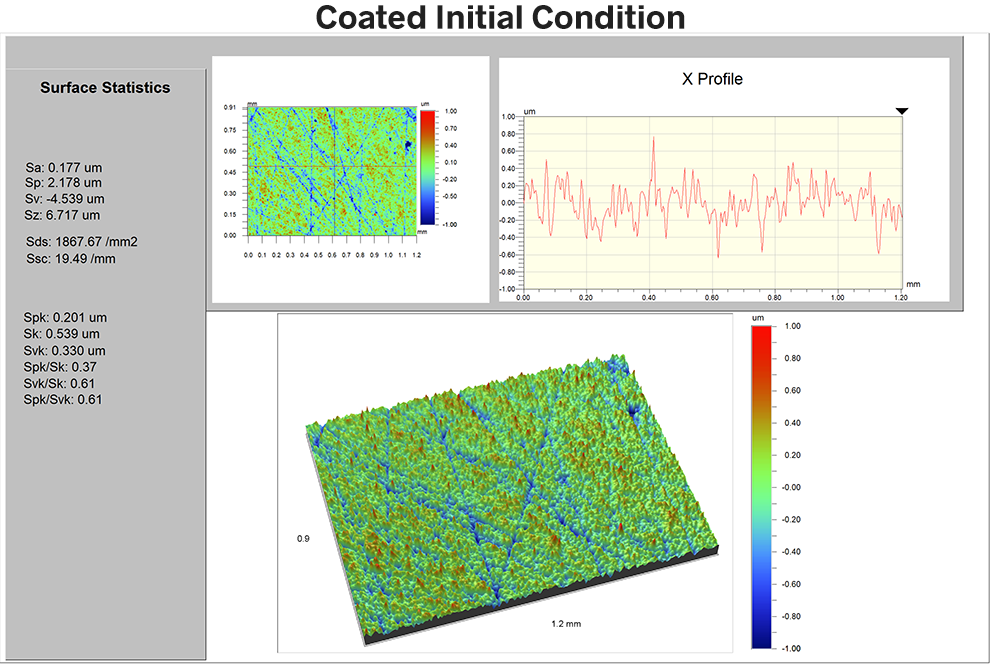
The Sa value is 167nm, Sds is 1868-2, and Ssc is 20 mm-1.
After the wear period the coated surface looks like this:
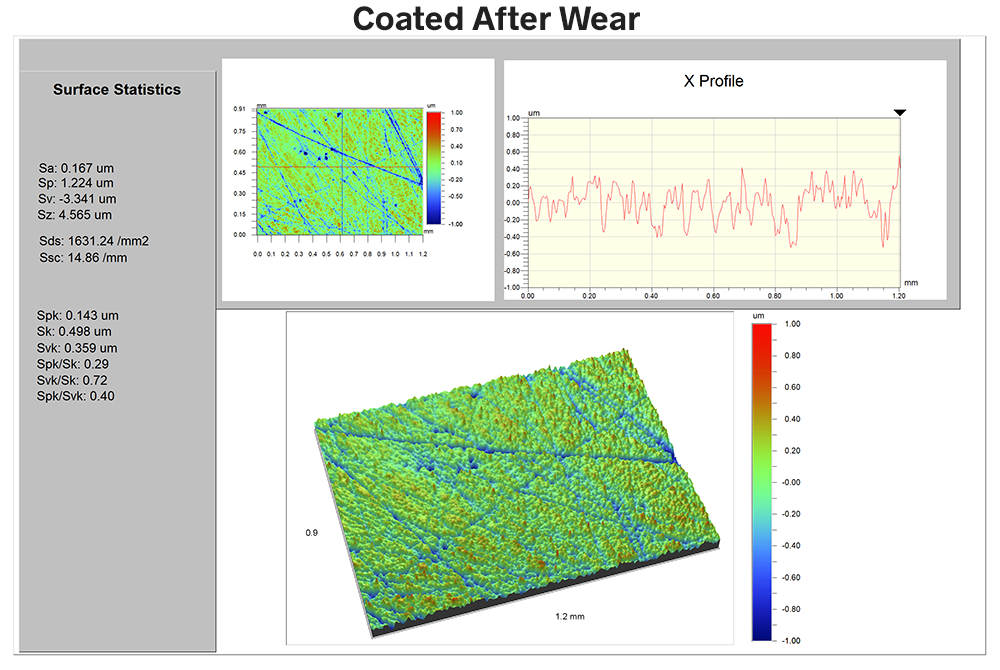
The first thing to notice is that the Sa value has only increased from 167nm to 177 nm—exactly the same 10nm change we saw with the uncoated surface. If we were merely using Sa to compare the two surfaces we might conclude at this point that the coating had no effect whatsoever…and we would be wrong.
The Ssc of the coated surface dropped from 20 to 15 mm-1 following wear—not appreciably different than for the uncoated surface.
However, notice that the Sds value dropped only slightly, from 1868 to 1600mm-2. This small drop indicates that the character of the surface has changed very little over the wear period—much different than the upcoated surface. Indeed, we can see this in the 3D data image as well: we find no pits, scratches or other evidence of significant wear. The coating has, in fact, reduced friction and thereby reduced wear. The Ssc and Sds parameters illustrate this—where Sa told us very little.
Measuring Ssc and Sds
It is important to note that the measured value of Ssc is dependent on the lateral resolution used to obtain the data. One must be cognizant of the lateral resolution and wavelength cutoffs in order to measure Ssc consistently, and to make sure everyone in the process understands the information being conveyed.
Learn more about Ssc, Sds and related parameters in our Surface Texture Parameters Glossary.