2D Stylus
Once 3D data is acquired, a number of surface calculations are performed simulating the measurement of the surface with a 2D stylus profiling device. The 3D data is considered as a series of profiles in parallel along the X and Y axes. Each profile is filtered according to the ANSI/ASME B46.1 Standard, with short wavelength and long wavelength cutoffs. A filtered profile may consist of multiple sampling lengths (typically equal to the long wavelength cutoff). The total length of a filtered profile is termed the Evaluation Length. For the WYKO data, there is typically only 1 cutoff length and thus the cutoff length equals the Evaluation Length. However, some application may result in multiple cutoff lengths (i.e. sampling lengths) per evaluation length. After filtering, the various surface texture parameters are evaluated for each profile. Finally, the average value for a given surface texture parameter is then found over all the profiles considered.
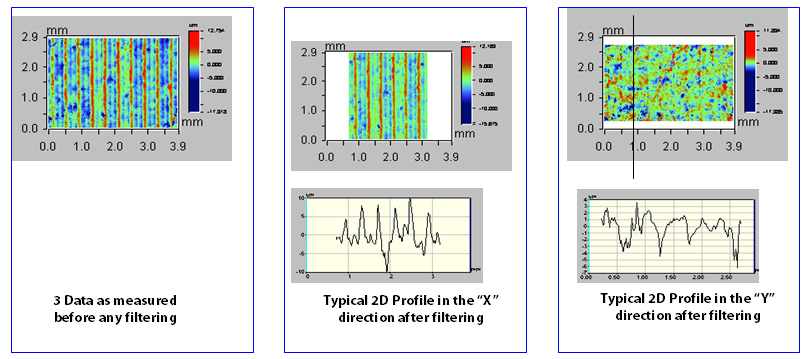
Typically, over 400 profiles are analyzed per 3D image in both the X and Y directions. The figure below demonstrates how a turned surface would appear after the various Stylus X and Stylus Y filters are applied prior to the evaluation of the individual profile.
Stylus X Ra, Stylus X Rt, Stylus X Rz, Stylus Y Ra, Stylus Y Rt, Stylus Y Rz
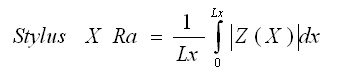
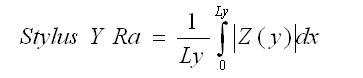
Stylus X Ra and Stylus Y Ra, the Average Roughness Along X and the Average Roughness Along Y, are found from the integral of the profiles along the respective directions:
Stylus (X, Y) Rt, the Maximum Profile Height Along (X,Y), is determined from the difference between the highest peak and lowest valley found along the evaluation length.
Stylus (X,Y) Rz, the Average Maximum Profile Height Along (X,Y), is derived from the average, over all cutoff lengths (i.e. sampling lengths), of the difference between the highest peak and lowest valley. Note, if the evaluation length equals the sampling length then the Stylus (X.Y) Rt and Stylus (X,Y) Rz values are equal.
Note that the value reported in the database is the average of all Stylus (X,Y) Ra, Rt, Rz values found over the 400+ profiles that comprise the 3D surface in the relevant direction.
Application
Stylus (X,Y) (Ra, Rt, Rz) may be useful in understanding any directionally dependent surface texture function. For example, a surface used for sealing may require a larger roughness average along the leak path direction (e.g. the X direction) and lower roughness average perpendicular (e.g. the Y direction) to the leak path for proper seal engagement.
Stylus (X, Y) Rk, Rpk, Rvk
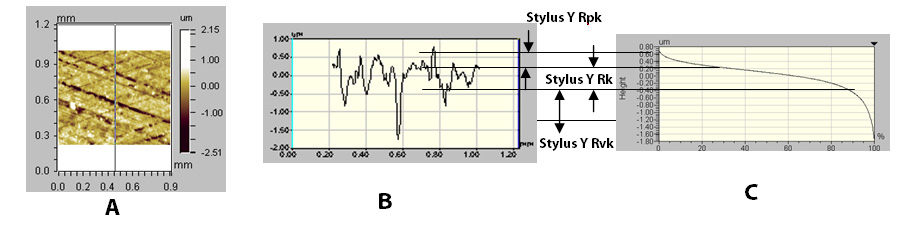
The Stylus (X, Y) Rk parameters, are derived from the bearing ratio curve based on the ISO 13565-2:1996 standard. For each profile, a bearing area curve is generated by simulating a horizontal line moving through the profile from the top down, evaluating the percentage of contact the line would make with the surface at each level.
From the bearing area curve, Stylus (X,Y) Rpk, the Reduced Peak Height Along (X,Y), is found from a measure of the peak height above the core roughness. Stylus (X,Y) Rvk, the Reduced Valley Depths Along (X, Y), is found from a measure of the valley depths below the core roughness. Stylus (X, Y) Rk, the Core Roughness Along (X, Y), is a measure of the core (peak to valley) roughness of the surface with the major peaks and valleys (established by Stylus (X, Y) Rpk and Stylus (X, Y) Rvk removed.
Note that each profile in the X and Y directions are evaluated individually and the resulting average of a given parameter is reported.
Application
A high Stylus (X, Y) Rpk implies a surface composed of high peaks providing small initial contact area and thus high areas of contact stress when the surface is contacted. Stylus (X, Y) Rpk may represent the nominal height of the material that may be removed during a running-in operation. Stylus (X, Y) Rvk is a measure of the valley depths below the core roughness and may be related to lubricant retention and debris entrapment. By comparing the various parameters along the different directions (X vs. Y) one may also assess the uniformity of the surface peak and valley distributions relative to a particular direction of interest. Stylus (X, Y) Rk is a measure of the nominal roughness (peak to valley) and may be used to replace parameters such as Stylus (X, Y) Ra, Stylus (X, Y) Rt, or Stylus (X, Y) Rz when anomalous peaks or valleys may adversely affect the repeatability of these parameters.
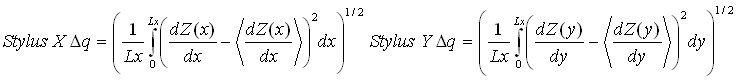
Stylus XΔq, Stylus YΔq
Stylus (X, Y) Δq is the Root Mean Square Slope Along (X,Y). The Stylus X Δq and Stylus Y Δq calculations find the rms (standard deviation) of the profile slope given by:
From Fourier analysis, the surface texture is composed of a series of sine waves in all directions with different spatial frequencies (i.e. 1 /spatial wavelength) and amplitudes. The power spectrum is a measure of the amplitude of each sine wave for a particular spatial frequency, along a given direction. Thus for a 3D surface, the power spectrum would be displayed as a “3D” function in which the X and Y axes represent the various spatial frequencies for a given direction. The amplitude of the power spectrum (displayed on the Z axis) represents the amplitude of the sine wave at a particular spatial frequency direction. The angular power spectrum is found by integrating the amplitudes of each component sine wave as a function of angle.
The figures below demonstrate a crosshatched surface, the power spectral density of the surface and the angular power spectral density function.
Application
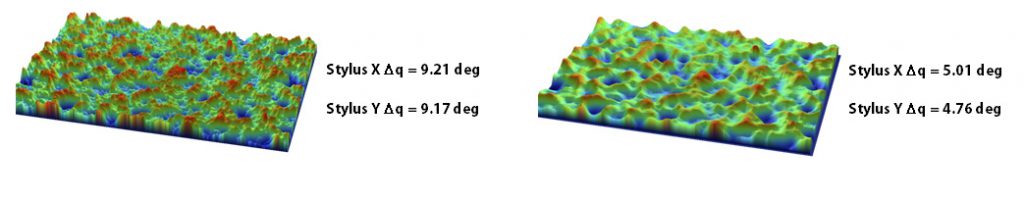
The Δq measurements along the X and Y directions provides a quantitative assessment of the rate of change of the surface heights over the profile length. Since the slope values are squared prior to integration, the polarity (i.e. positive or negative) of the slope is lost in the calculation. The Δq measurements may be useful in applications where a machining process is producing parts with nominally correct amplitude parameters (e.g. Ra) but has other functional or process problems. For machining operations, parameters associated with the materials or machine setup may be manifested in significant changes in the surface slopes, easily measured by Δq. The wetting characteristics of a surface and the surface area of a texture may be related to Δq.
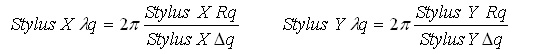
Stylus Xλq, Stylus Yλq
Stylus (X ,Y) λq , the Root Mean Square (rms) Profile Wavelength Along (X, Y), is a measure of the dominant spatial wavelength that comprises the surface weighted by the amplitude of the various spatial components. The evaluation of these parameters stems from Fourier analysis of the surface texture resulting in the following:
Application
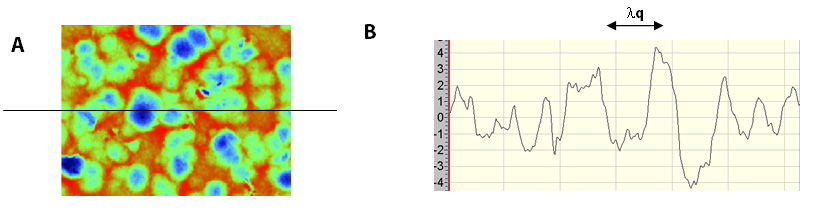
The λq measurements along the X and Y directions provide a quantitative measure of the key spatial wavelengths that comprise the texture in the respective directions. A surface that has a high amplitude long wavelength wavy structure on which are superimposed small amplitude short wavelength texture features will have a λq representative of the long wavelength structure. However, as the amplitude of the shorter wavelength structure begins to approach that of the long wavelength structure, the measured λq will seek a value somewhere between the long wavelength and short wavelength values. λq is used when tool feed rates are under investigation and as a further means to differentiate surfaces/processes that yield similar amplitude parameters (e.g. Ra) but function differently. λq may be related to the appearance of a surface and also the real area of contact between loaded components.
Stylus X Pc, Stylus Y Pc
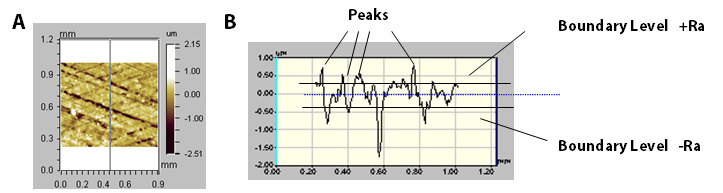
Stylus (X,Y) Pc the Peak Density Along (X,Y), measures the number of peaks per unit length in the X and Y directions respectively. A peak is defined as when the profile intersects consecutively a lower and upper boundary level set at a height above and depth below the mean line, equal to Ra, for the profile being analyzed.
Application
Stylus X Pc and Stylus Y Pc are useful parameters for assessing the peak density (e.g. peaks/mm) along a given direction. Applications involved in coating a surface, or when fluid leakage/retention are of issue may make use of the Pc parameters to optimize the surface texture design. Sometimes the combination of parameters such as Rz with Pc will yield additional information about the spacing and depth of dominant surface features that may affect
the function of a component.
Stylus X Rsm, Stylus Y Rsm
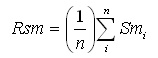
Stylus (X,Y) Rsm, the Mean Profile Spacing Along (X,Y), is a measure of the average length between points along the profile which cross the mean line with the same slope direction. For a profile element to be considered, the feature must extend above and below the mean line by more than 10% of Rz and be spaced apart from a previous feature by at least 1% of the sampling length.
Application
Stylus X Rsm and Stylus Y Rsm are used to understand the dominant width of features and thus may be useful in understanding chanels for fluid flow and void space for coating coverage applications. Depending on the material properties, closer spaced texture (i.e. small Rsm) may be more prone to plastic deformation upon contact than wider spaced (i.e. large Rsm) features.
Stylus X Ra/Stylus Y Ra, Stylus X Rz/Stylus Y Rz,
Stylus X Δq/Stylus Y Δq, Stylus X λq/Stylus Yλq,
Stylus X Pc/ Stylus Y Pc
The various Stylus X/Stylus Y ratios are found by dividing the corresponding Stylus X parameter(e.g. Stylus X Ra) by the corresponding Stylus Y Parameter (e.g. Stylus Y Ra). Thus the various ratios are unitless quantities.
Application
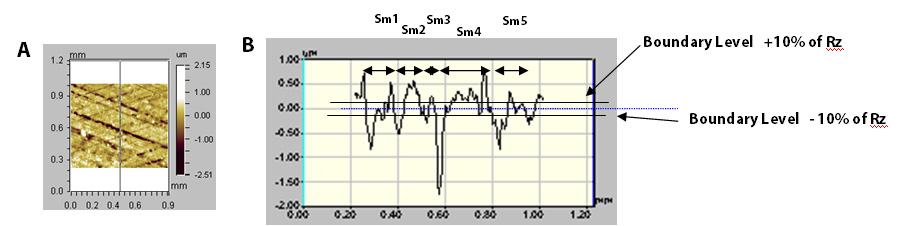
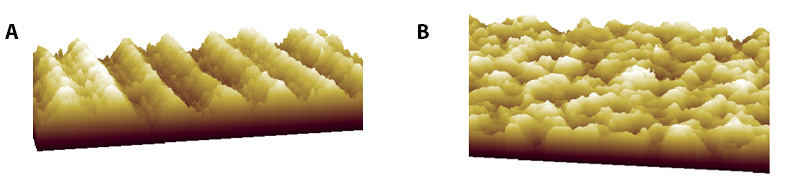
The ratio of the various Stylus X and Stylus Y parameters demonstrates the spatial isotropy of the surface texture. For example, the lathe-turned
surface (Figure A) has a high degree of anisotropy and thus the ratio of Stylus X Ra/Stylus Y Ra is greater than 1.00. A shot peened isotropic surface will tend to have Stylus X & Y ratios of about 1.00. The ratios may be used to assess the ability for a given surface finishing operation to remove remnants of a previous operation. The ratios may also be used to uncover any dominant surface directional paths that may contribute to fluid leakage.