Many companies use both stylus and optical measurement technologies to measure surface texture. A question that we are often asked is, “Can the measurements between these different systems correlate, and can they produce the same numbers?”
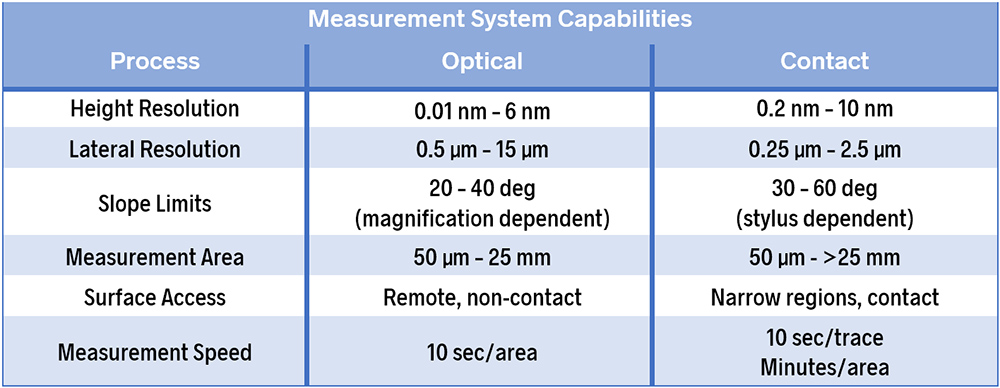
The starting point for answering these questions is to consider the limitations of each instrument. The chart below highlights some of the important considerations.

Height (vertical) resolution
Vertical resolution dictates how finely a system can measure height variations. The measurable height ranges overlap quite a bit between the two technologies. However, optical systems can resolve much finer heights than most stylus systems. If you are measuring a super-smooth surface, the result from an off-the-shelf skidded stylus likely would not correlate to the results from an optical profiler or phase shifting interferometer because the latter systems can detect variations that the stylus cannot.
Spatial (lateral) resolution
Lateral resolution dictates the smallest spatial wavelengths that a system resolve. The radius of the stylus tip and the fidelity of the instrument will determine the lateral resolution.
It’s important to note that a large radius tip may produce very low Ra (roughness average) values, leading to the conclusion that a process is creating very smooth surfaces. In reality, the surfaces may be measured as “smooth” because the system can’t quantify the actual, finer-spaced height variations.
Slope
The stylus geometry and optical characteristics, may limit the steepness of slopes that can be measured. A 90-degree stylus, for example, may contact the walls of steep slopes, skewing the results. Optical systems may be limited on steep slopes because insufficient light reflects back to the sensor.
Other considerations will also affect how well measurements will correlate, including variation in the size of the measurement area, accessibility to the features, and measurement speed. The types of filters used in the software, scan lengths, and other variables also come into play.
So the question remains: if we do our best to control all of the source of variability, can we get the two types of instruments to correlate?
Case Study
A few years ago, we did a study looking at just this question. In this project we measured clutch plates using both a handheld stylus and a white light vertical scanning optical profiler. Through some experimentation we determined the best measurement characteristics in order to reduce variability between the instrument results.
What we found is that surface texture parameters such as Ra (Roughness Average) and Rpm (Average Maximum Peak Height) correlated very well, while other parameters, such as Rsk (Skewness) and Δq (Root Mean Square Slope) correlated (i.e., produced high R2 values) but did not produce similar values.
After working through the data and talking to instrument manufacturers, we concluded that amplitude-based parameters (such as Ra and Rpm) tend to correlate well because they are based on the average of the amplitudes, and averaging tends to minimize the differences between the acquisition methods.
When parameters are dependent upon spatial wavelengths (such as slope and spacing), it becomes challenging to produce the same results between technologies. This has to do in large part with differences how the instruments sample the surface as they acquire the data. Optimizing the filters and cutoff wavelengths can minimize the differences but can’t eliminate them.
The ways in which the systems interact with the surface also affect these parameters. A stylus, for example, can create artifacts as it bounces across features, or it can pass around peaks instead of over them. An optical system may have its own issues, such as creating scatter patterns. These physical limitations are difficult to account for and will all affect how well the measurement results can correlate.
You can find out more about measurement instruments and their capabilities in the first module of our Surface Roughness, Texture and Tribology short course, available in its entirety or as individual class modules on udemy.com.
