Ra
Average roughness is the average departure of the roughness profile from its mean line.
This video shows how we define Ra (2D average roughness), as well as Sa, the 3D (areal) average roughness:
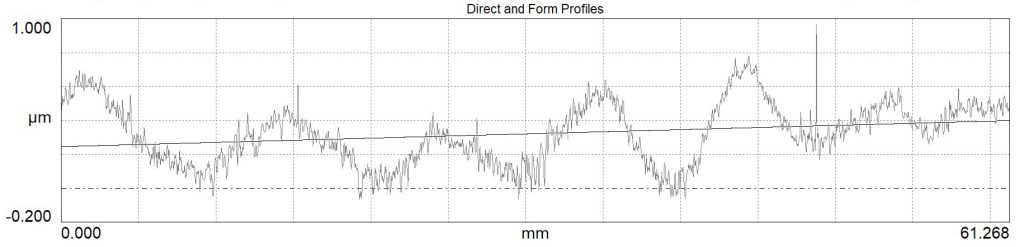
Ra is derived from the “roughness profile.” To obtain the roughness profile, we start with a Raw (measured) Profile, then remove the overall form (the large-scale shape) of the surface:
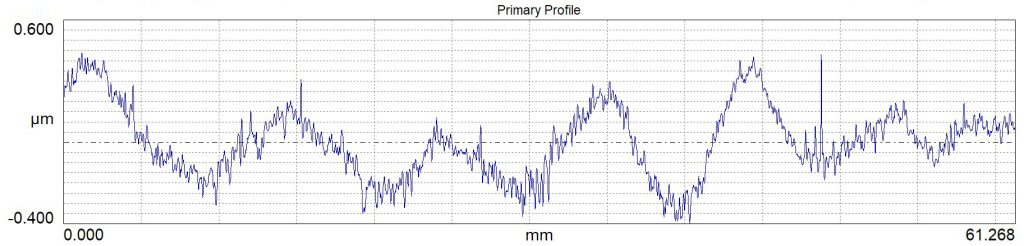
We then filter out the short spatial wavelengths. These may be noise or small shapes that aren’t applicable for the application. The result is called the Primary Profile:
Next, we filter out the long spatial wavelengths which would be considered “waviness.” What remains are the spatial wavelengths we will call “roughness” in our application, and this data is called the “Roughness Profile.”
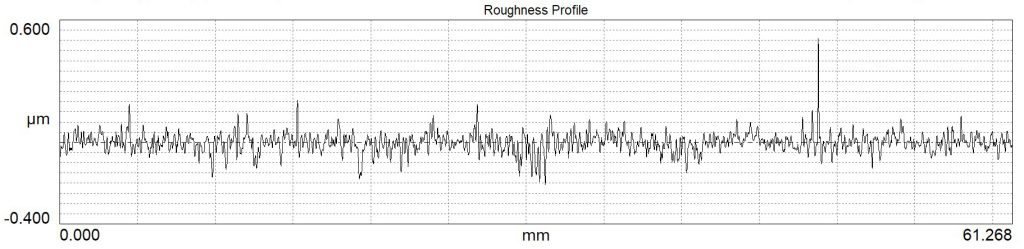
The 2D roughness parameters (“R” parameters) are calculated from the Roughness Profile.
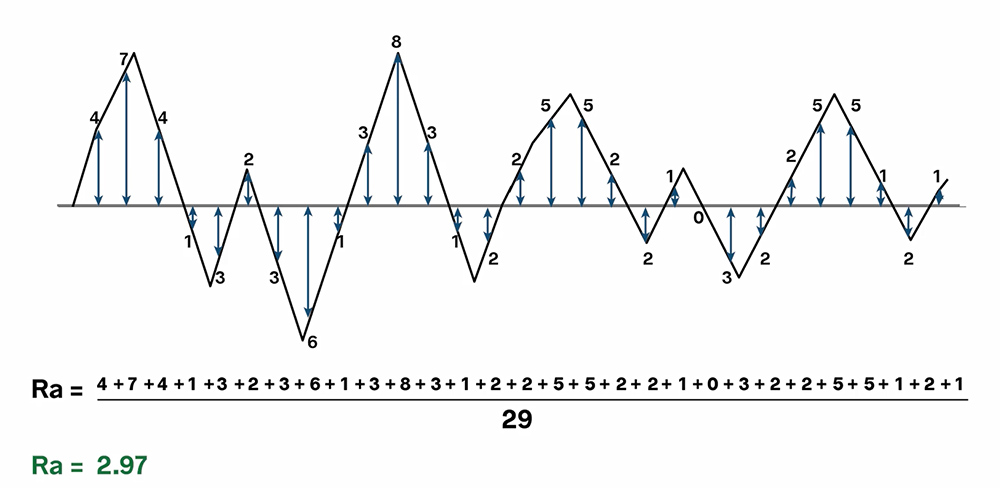
Ra, is the average height of the roughness profile, most commonly referred to as the “average roughness.” To calculate Ra, we:
- find the best fit mean line through the profile
- add up the absolute distance from the mean line to each point on the profile
- divide by the total number of measured points.
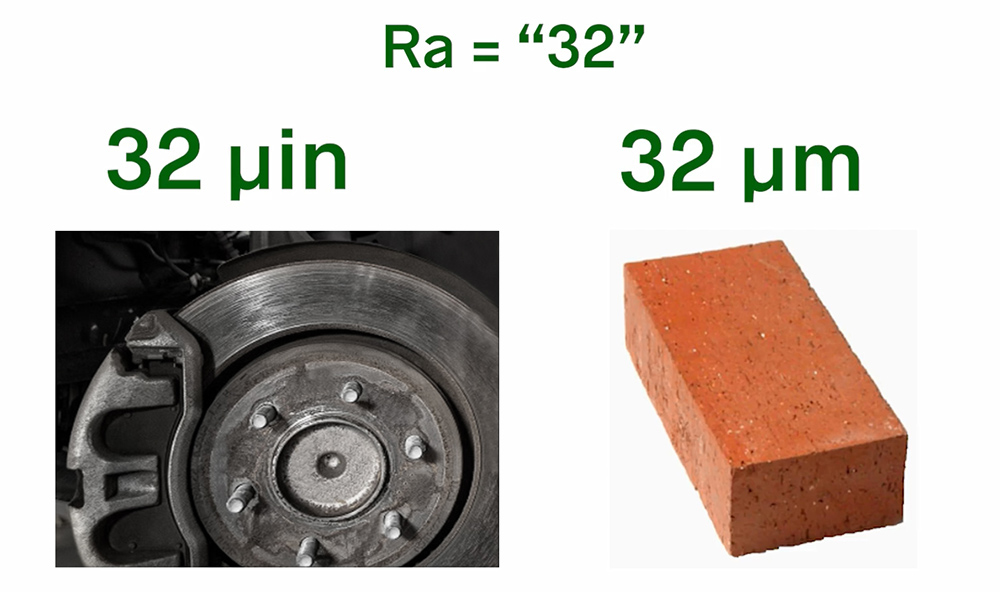
Average roughness is typically measured in microns or micro-inches. That’s important: Ra has units. An Ra value without units is essentially meaningless. An Ra of 32 µ-in would be typical of a machined surface…but an Ra of 32 microns would be more like the surface of a brick!
Average roughness can provide a sense of the overall height of surface texture. It can also indicate when a process has changed in some significant way.
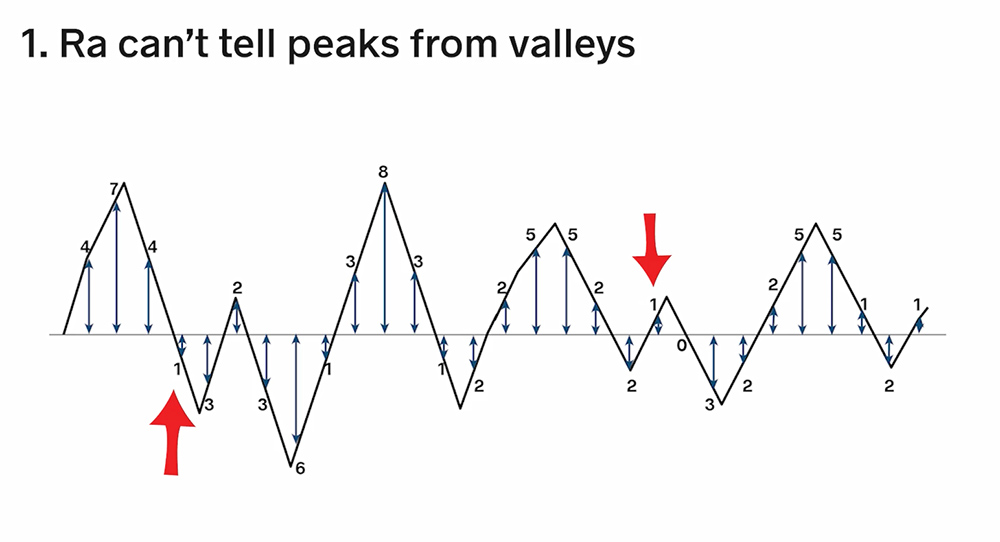
But Ra can’t always tell us everything we need to know about a surface. This animation shows how very different surface can have the same Ra.
First, Ra sees heights as absolute values. A point 1 micron below the mean line will have the same impact on Ra as a point 1 micron above it—so Ra can’t tell peaks from valleys.
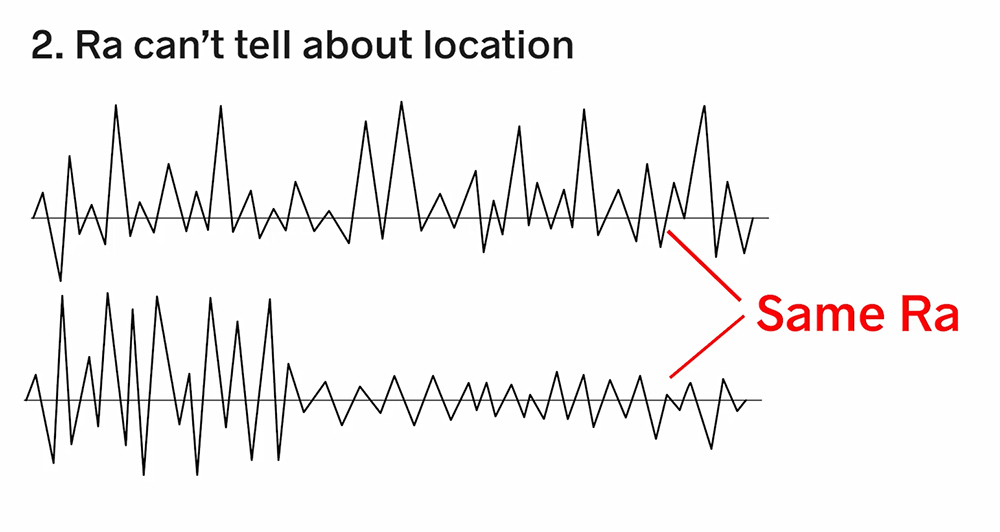
Second, average roughness can’t tell where features are on the surface. A surface with randomly scattered peaks will have the same Ra as a surface with those peaks clustered in one place, and that could lead to scratching, gouging, premature wear, etc.
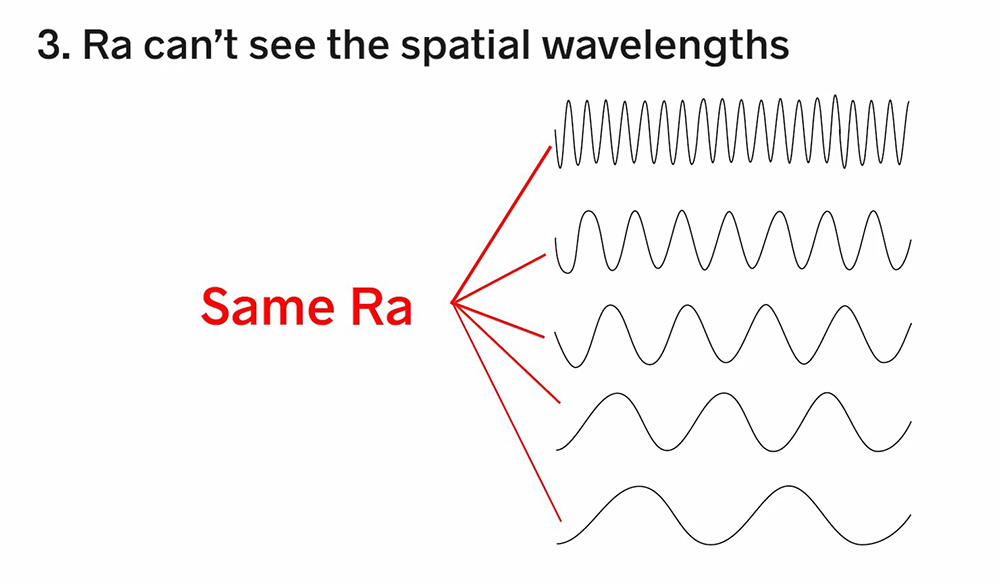
Third, Ra can’t provide information about the spatial wavelengths that make up the texture. The profiles below all have the same Ra value, thought they would perform very differently if we were concerned about appearance, fluid flow, contact area, and so on.
3D Average Roughness
Sa is the areal (3D) average roughness. It’s calculated similarly to Ra, but for the entire S-L surface area rather than a single 2D profile.
By definition, Ra is derived from 2D data, and Sa is calculated over an area, so while they are both average roughness values, they are NOT equivalent. We talk more about this in this blog post.
Most 3D surface analysis software provide tools that let you draw a 2D trace through the data and calculate Ra over that profile. However, it’s difficult to select the exact same trace through the data more than once, so most likely you will get different Ra values every time.
Some 3D analysis software includes Stylus XRa and Stylus YRa parameters. As we talk about in this blog post, these parameters are calculated as follows:
- Determine the mean height of each trace in either the X or Y direction
- Adjust each trace so that its mean height equals 0
- Calculate the Ra value for each trace, and
- Average the Ra values of all the traces.
The Stylus Ra parameters are not equivalent to Ra or Sa. Because they are calculated over many 2D traces, they will almost always give different values than Ra. And, because we level the mean heights for each trace and calculate the deviations in one direction only, they also aren’t equivalent to Sa. They do, however, let us filter out a dominant structure in one axis in order to see smaller roughness features in the other direction.