Paint appearance is critical to the perception of quality, particularly in consumer goods such as automobiles. We’ve written frequently in this blog about surface texture consisting of a spectrum of spatial wavelengths, ranging from short-wavelength roughness through longer-wavelength waviness. The term “multiscale spectral analysis” refers to this technique of analyzing the spatial wavelengths that make up a surface’s texture.1
An application for automotive paint finishes helps show how multiscale analysis can be a powerful quality control tool. Several years ago automobile manufacturers were facing a vexing issue: paint finishes on body panels were not matching, even when the panels went through identical paint processes. Front doors did not even match back doors! Yet, all of the substrate steel for the panels met specifications.
Multiscale spectral analysis proved to be the tool to unlock the mystery. This post references results from PNT1004 USCAR Painted Surface Prediction Project SO242895 (Peat, A., et al).2 This material was also presented at the Detroit Society for Coatings Technology’s FOCUS 2015 conference (“Substrate Surface Texture “Spectroscopy” and the Prediction of Final Paint Appearance”).
Why paint appears as it does
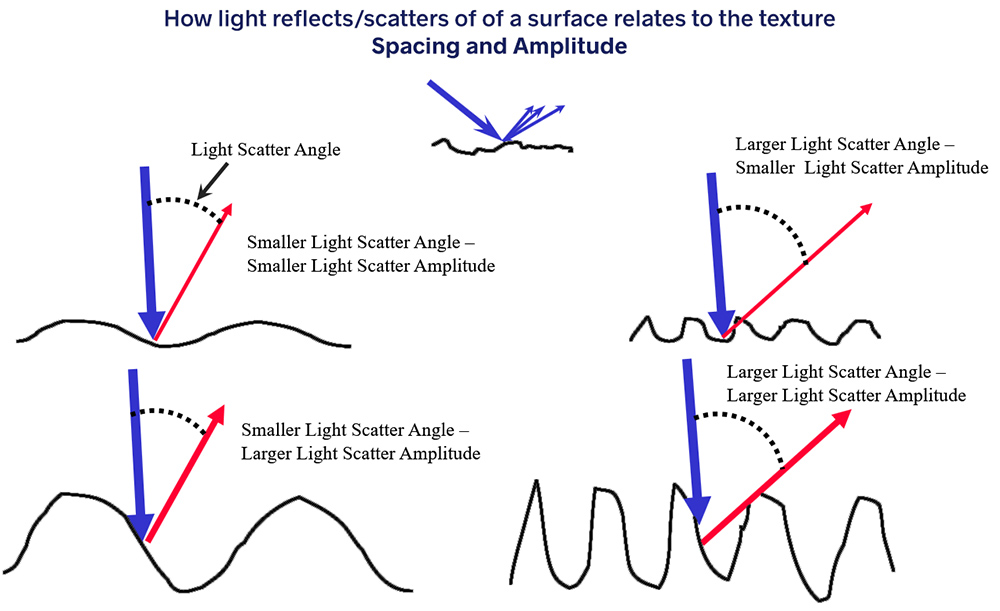
Paint finishes reflect light off of their surfaces. Light scatters differently depending on the spacing and amplitude of the surface texture. Our interpretation of the “quality” of a finish is based primarily on these two aspects of the surface texture.
To track and control paint finishes, most auto manufacturers use a device called a BYK Wave-Scan (shown below). The device is rolled across a panel to record how light scatters from the surface.
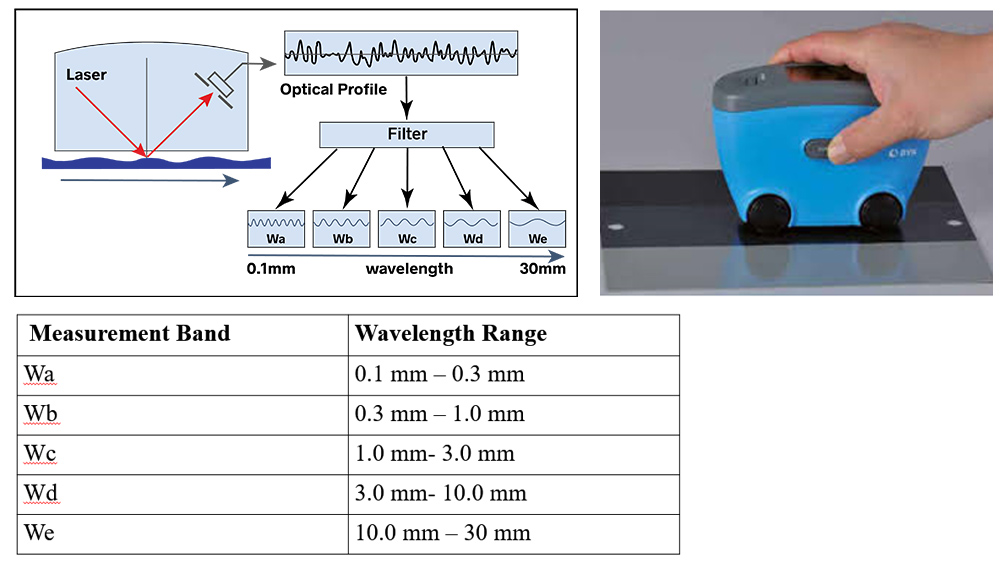
Based on the scattering, the BYK reports the amplitude of five specific spatial wavelength bands: Wa (shortest) through We (longest). By recording the amount of scattered light in each band, manufacturers can control their finishes and “tune” them to the correct mix of amplitudes for each band.
When paint does not match
As we mentioned earlier, the challenge facing manufacturers was that paint finishes did not match between various body panels. Tthe paint processes were in control and the incoming material met spec.
The particular specification was SAE J911, setting the surface texture requirements for incoming steel. J911 which was first developed in 1965. It calls out an Average Roughness (Ra) value as measured between the spatial wavelengths of 8 µm and 0.8 mm—standard values for 2D profiler measurements. The specification also calls out a Rpc (Peak Count) value, which is a measure of the spacing between peaks.
In analyzing the paint discrepancy issue, all incoming steel was found to meet both the Ra and Rpc specs. It was clear that these parameters on their own were insufficient to discern a “good” substrate from a “bad” one. Manufacturers sought another method that would allow them to measure as-received steel and predict the final paint appearance that would result.
Applying multiscale analysis
The BYK device is one application of multiscale analysis. Looking at BYK results researchers could see that variations in the Wb band in particular could be correlated to “good” and “bad” final finishes. They predicted that they might find similar, wavelength-specific discrepancies in the incoming steel. Unfortunately, the BYK Wave-Scan proved incapable of measuring the steel as the bare surface scattered the light scattering more than the device could register.
Newer optical instruments, specifically, optical 3D profilers, made it possible to measure the substrate steel in high resolution. By stitching together multiple measurements the researchers could assemble large enough scans to discern all of the spatial wavelengths of interest for the application.
A range of panels was selected for measurement. The images below show the measured surfaces of the Best of the Best (BoB) and Worst of the Worst (WoW) panels in the sample, as measured across all wavelengths. “Sa” in these measurements is the areal (3D) average roughness, the counterpart to two-dimensional Ra. “X-Spacing” refers to the spacing in the x-direction and is directly related to Rpc.
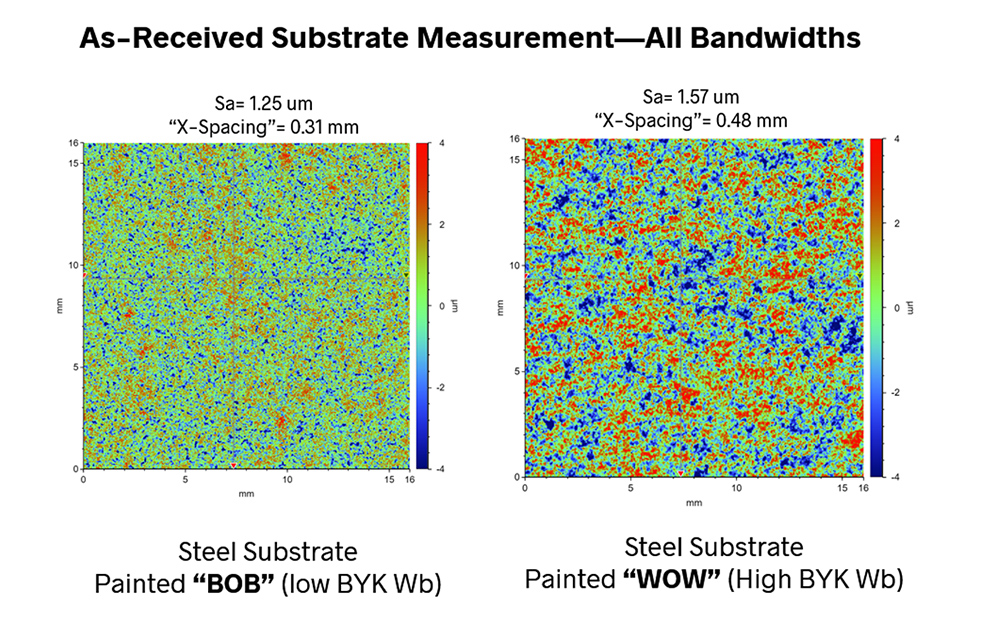
In this data, the difference between the BoB and WoW measurements are not significant enough to conclusively tell a “good” panel from “bad.”
The next step in the research was to examine various spatial wavelength bands. Researchers first focused on using the cutoff wavelengths specified in the J911 spec: 8 µm – 0.8 mm:
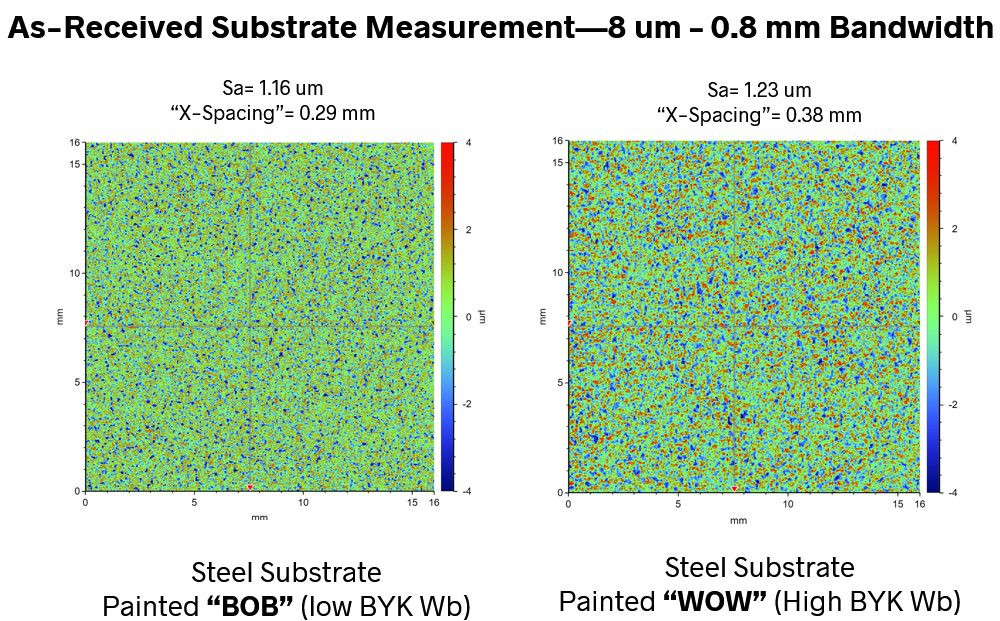
Again, no discernable difference could be detected. Indeed, the two panels appeared even more similar than when all spatial wavelengths were analyzed.
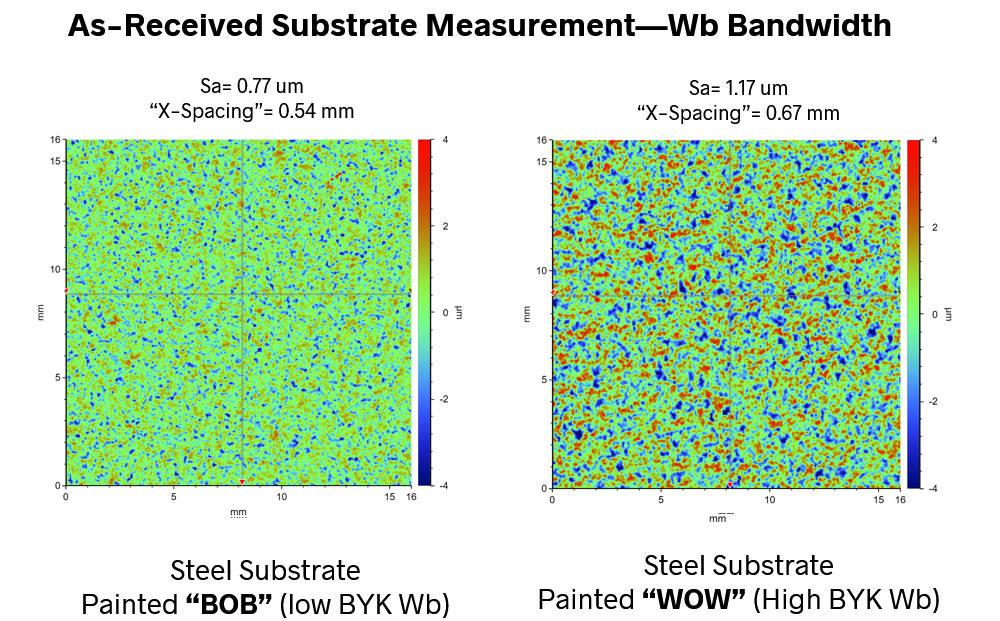
Next, researchers matched the spatial wavelength band as closely as possible to the “Wb” band of the BYK Wave-Scan (the band of greatest variability in the final paint finishes). Choosing cutoff values that would simulate the Wb range, the researchers found that the Sa values varied greatly. Sa for the WoW surface was almost 50% higher than that of the BoB surface! They had found their culprit.
So, how did this issue slip through the specification?
We know that, due to the nature of filtering, amplitudes are greatly attenuated at spatial wavelengths very close to the cutoff wavelength. As it turns out, the 0.8 mm cutoff in the J911 specification was, unfortunately, right at the center of the most variable spatial wavelengths. The very discrepancies that the measurement was intended to uncover were being attenuated—and therefore hidden—by this choice of cutoff wavelength.
Multiscale analysis leads to an improved specification
Through multiscale analysis it became evident that the J911 specification needed to be reconsidered. The cutoff wavelengths, which had worked well for automotive finishes on steel from a single manufacturer, were no longer applicable. The industry saw it this way as well: in 2017 the specification was rewritten to include different measurement band wavelengths.
Today’s automotive finishes must overcome much more variability than was present in the cars of the 1960s. Finishes must match between materials ranging from aluminum to carbon fiber. Components follow long supply chains before arriving at the paint line. And, as manufacturers move to thinner paint finishes for environmental and performance reasons, there is less material to hide any discrepancies. But modern measurement techniques such as multiscale analysis give manufacturers the tools they need to properly specify, measure and control all aspects of finishing, and to keep up with the quickly changing automotive world.
REFERENCES
1. Brown, C. et al, Multiscale analyses and characterizations of surface topographies, CIRP Annals, Volume 67, Issue 2;2018, Pages 839-862.
2. Peat, A., et al, PNT1004 USCAR Painted Surface Prediction Project SO242895.