If you work with precision surfaces, you’ve most likely encountered callouts for surface roughness/surface texture.
At first glance, roughness may seem straightforward…you run a roughness gage over a surface, it reports a number, and you make sure that the number is within spec. But there’s a LOT more to texture specification and measurement, and it can affect everything from sealing to friction, wear, appearance, noise…
In this series we’ll take you through the basics of surface roughness and how it’s defined, specified, measured, and analyzed. Along the way we’ll point you to additional resources that you can use to further your knowledge.
Want to take a deeper dive into these topics? Check out our Surface Roughness, Texture, and Tribology classes, on-line, and in person.
Now…on with the show!
#1: What is Surface Roughness?
When people talk about the roughness of precision surfaces, they often talk generally about the peaks, valleys, and other shapes that make up a surface. That’s essentially true…but in the world of precision surfaces, “roughness” has a more specific meaning.
Surface texture
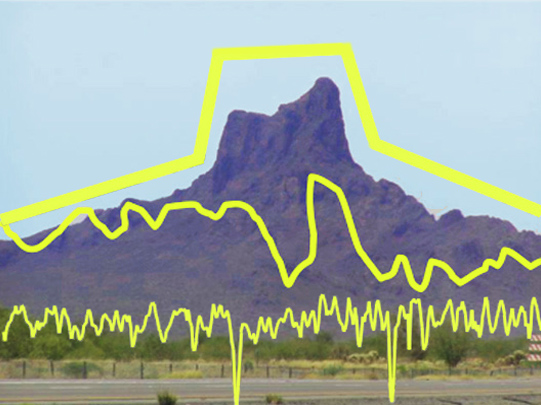
All of those surface shapes taken together are most correctly called the “surface texture.” Think of a mountain that consists of peaks, ridges, ravines, etc. It’s also covered in pebbles, rocks, boulders, dirt… All of those shapes make up the shape of the mountain.
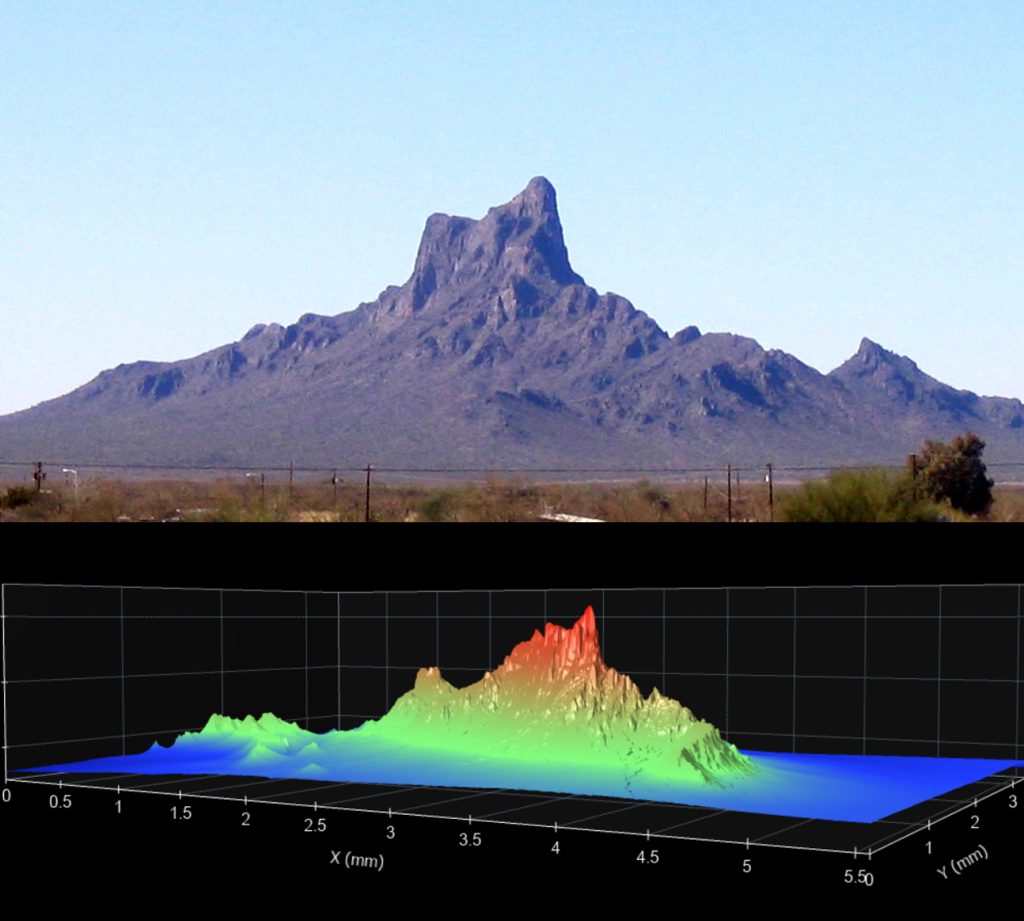
The texture of this mountain consists of the mountain itself plus boulders, rocks, pebbles, sand…
Roughness is part of surface texture
“Roughness” is a range of shape sizes within that total texture that we care about for an application. That’s important: what we call “roughness” depends on the application. There are no hard, fast dimensions that define roughness; we define the range for each application.

What we call “roughness” depends on the application.
Going back to the mountain, if the “application” is a hike, we may want to know some information about the pebbles and rocks along the path so we can wear the right shoes. If we’re driving a Jeep up the mountain, the pebbles and rocks won’t affect our ride. We need to focus on the boulders, dips, and crevasses. The size of the shapes that we call “roughness” will change with the application, and it’s up to us to define that range in order for “roughness” to be meaningful.
Watch our How Rough is Roughness? video to learn more.
In our next post in this series we’ll look at the other scales of shapes that are part of texture but may not be roughness. We’ll introduce the concept of “filtering” to isolate the features that we care about.
#2. Roughness, Waviness, and Form
In our first Roughness Top 10 post we introduced surface roughness as one component of surface texture. So, what makes up texture that isn’t roughness?
Smaller than “roughness”
Roughness refers to a range of shapes that we care about for our application. There will also be smaller shapes in the texture—all the way down to the molecular or atomic scale. Those shapes may or may not matter for the application. If we’re making engine components, say, molecule-scale shapes likely will be too small to matter. But if we’re making computer microchips, shapes at those scales may be the difference between a working chip and a failure.
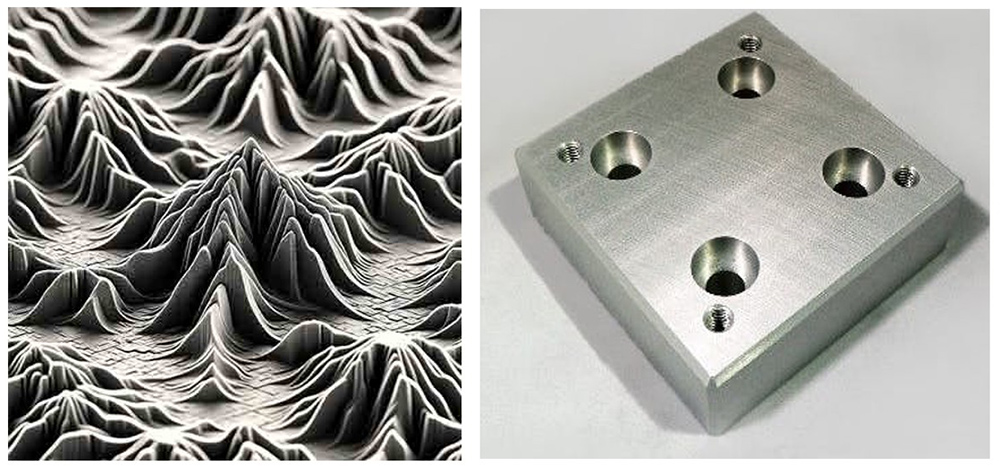
Roughness features that might scrap a silicon wafer would be negligibly small for a machined surface.
Larger than roughness = waviness
“Waviness” refers to valleys and hills that are larger than the range of shapes we’re calling roughness.
Both “roughness” and “waviness” may be important for part function. In roller bearings, for example, controlling the roughness is critical for reducing friction and wear. Controlling waviness may prevent chatter or leak paths that could allow a lubricant to escape. Being able to treat roughness and waviness independently gives us greater control over both aspects of the texture.
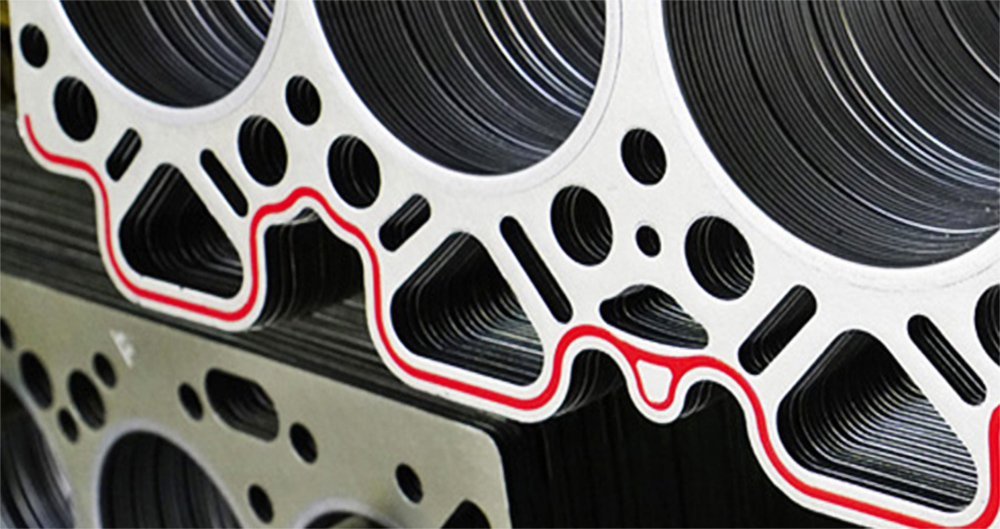
Will this gasket seal? The roughness AND the longer-wavelength waviness might both be important.
Larger than waviness = form
The largest, overall shape of a surface is referred to as the “form.” Form may be the tilt of a flat surface, the cylindrical shape of a shaft, or the spherical shape of a ball bearing. More complex forms can be described mathematically. Form typically dominates the other texture components, so we typically remove it as a first step in analyzing texture—a necessary step so we can see the smaller features.
A spectrum of sizes
As we’ve been describing, surface texture consists of a “spectrum” of shape sizes, ranging from the smallest spikes to the largest form. Taken together, this spectrum of shapes gives us the overall texture of a surface.
Roughness, waviness, and form of a mountain. Read our Take a Hike article to learn more.
The term “spatial wavelengths” refers to this range of feature sizes. Shorter spatial wavelengths are toward the roughness end of the spectrum, while longer wavelengths may be considered waviness, with very long wavelengths being considered “form.”
As we’ll see in the next post, we use the process of Filtering to isolate the feature sizes (spatial wavelengths) that we care about for our particular application.

Want to take a deep dive into roughness? Check out our Surface Roughness, Texture, and Tribology Classes, available online and in person.
#3 Filtering
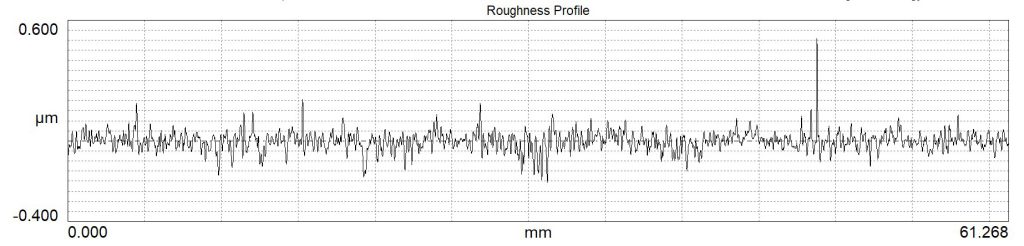
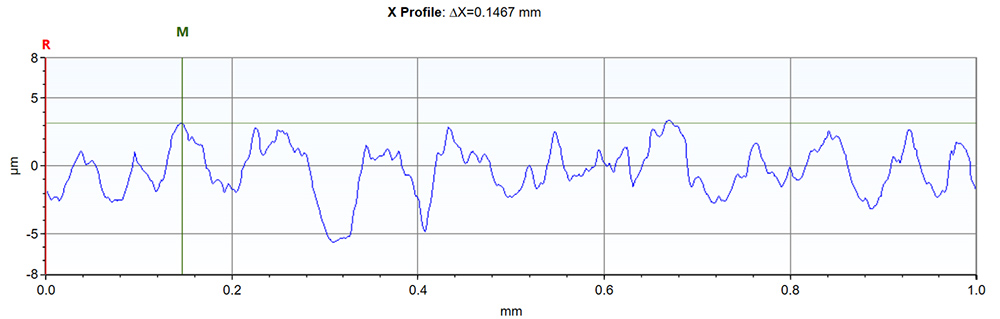
A surface texture measurement contains the height of each point along a line (profile) or over an area (surface). Here’s a profile measurement of a machined metal surface:
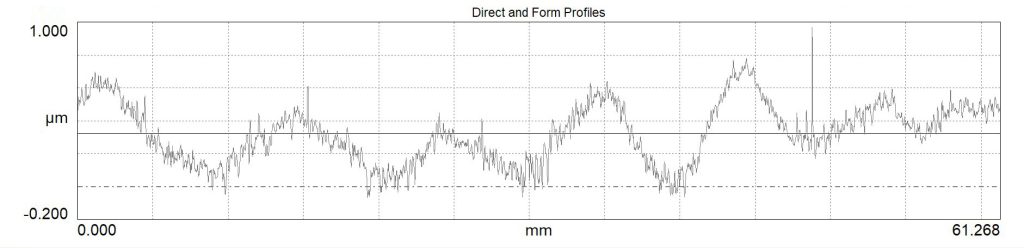
This measurement was made with a stylus profiler, which measures surface heights by moving a sharp stylus across the surface. The raw measurement data depicts how the stylus tip deflected as it moved across about 61 mm of that surface.
The raw, or direct, measurement data contains all of the spatial wavelengths that our measurement system is capable of measuring. But there’s more information there as well…
By eye, we can see that this machined surface consists of some finer, spikier shapes (roughness) and also some larger lumps (waviness). The tilted line running through the measurement is a section of the mean plane, which shows that the surfaces also has an overall tilt (form).
If we were to take an average of all of the points on this surface, we’d get a very general idea about the texture…but that can only tell us so much. We want to be able to isolate the spikes, lumps, and other aspects of this surface so that we can understand how they will affect performance.
Step A: Remove the form
First need to remove the overall form, or geometry, which may be much larger in amplitude than the roughness or waviness. Unless we remove form from the measurement we can’t accurately assess the much finer details.
To remove the form from our turned data, we tilt the entire measurement so that the mean plane is exactly horizontal.
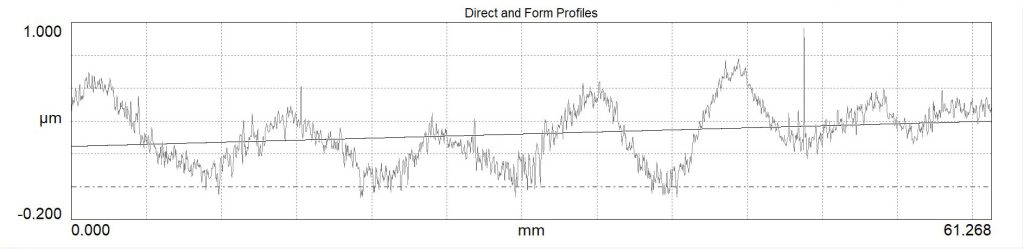
Similarly, we could remove cylindrical or spherical form, or we could approximate and remove a more complex form using polynomials.
Step B. Define the lower end of the “roughness” range
To isolate the features that matter to our application, we use the process of “filtering” to suppress features that are smaller or larger than the range of features we care about.
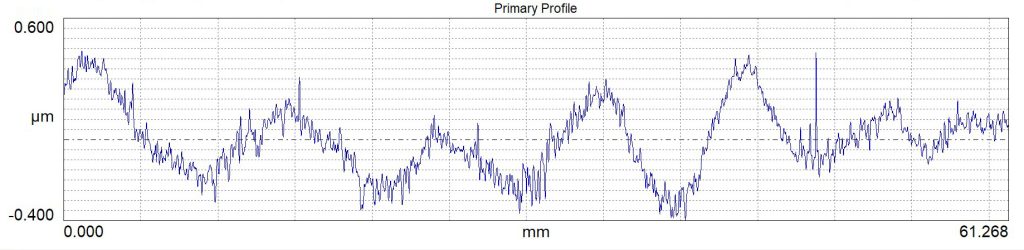
After removing form, we filter out the smallest features (spatial wavelengths) which may be beyond the resolution of our measurement system, or which may just be too small to affect our application. We suppress these feature sizes by applying a “Short Filter,” or S-Filter. The
S-filter is applied at a specific wavelength (the Short Filter Cutoff Wavelength, or λs). We choose λs based on the wavelengths that matter for our application.
With the S-Filter applied, we have just the spatial wavelengths larger than the short filter cutoff wavelength. This data is called the Primary Profile.
Step C. Define the upper end of the roughness range
The Roughness Cutoff Filter, or Roughness Filter, separates the smaller feature sizes that we will consider roughness from the larger features we’ll call waviness. The cutoff is applied at the Roughness Filter Cutoff Wavelength, or λc, or the L-Filter.
Feature sizes larger than λs and smaller than λc will be considered roughness. This data is called the Roughness Profile.
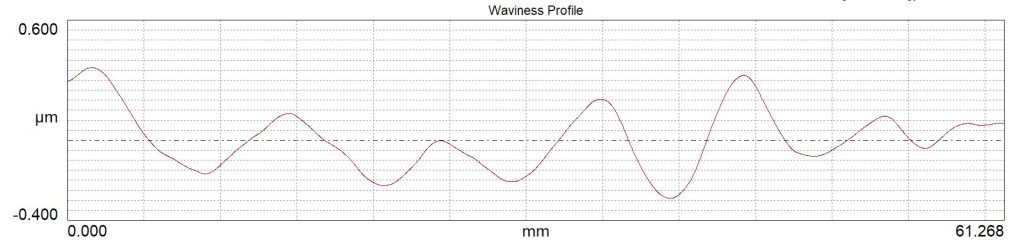
Features larger than λc will be considered waviness. This data is called the Waviness Profile.
We’ve now isolated the finer roughness features (which may be caused by tool wear, etc.) from the larger hills and valleys, which might be due to tool chatter, feed and speed settings, etc. We can now analyze the components of the surface texture that will impact how our surface will perform.
#4. Average Roughness
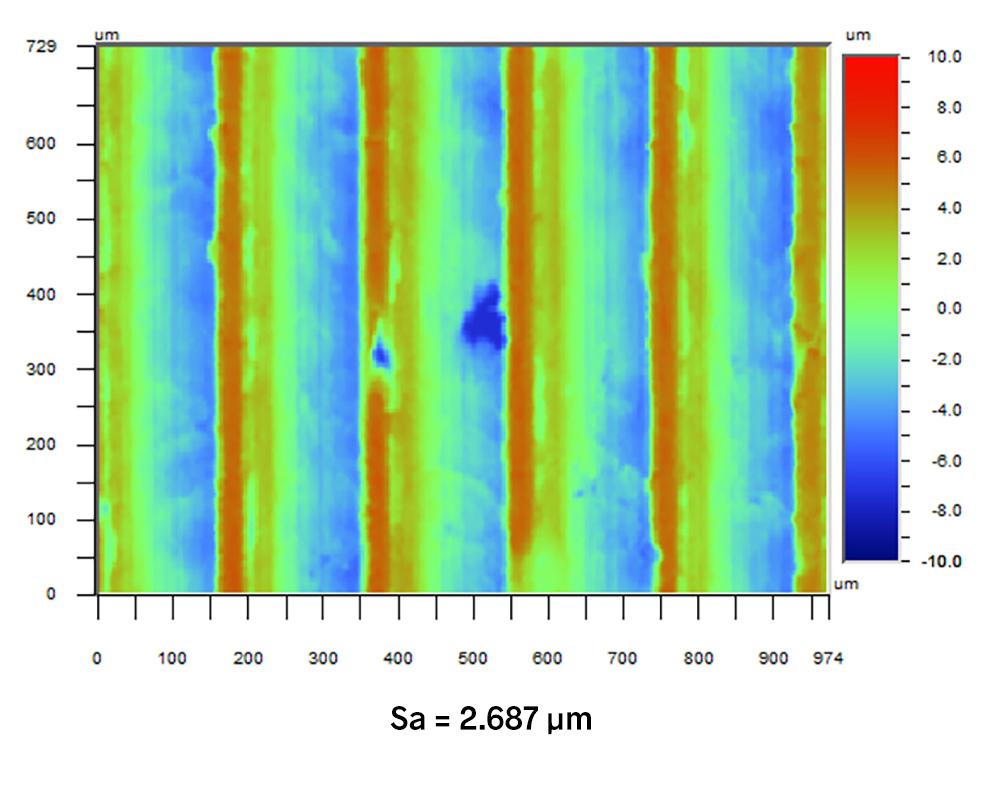
Average Roughness is the most widely specified parameter for controlling surface roughness. It’s represented by Ra for two-dimensional (profile) measurements, and Sa for 3D (areal) measurements.
To calculate average roughness, measure the absolute distance from each measured point to the mean line/plane. Then, add up those values and divide by the total number of measured points.
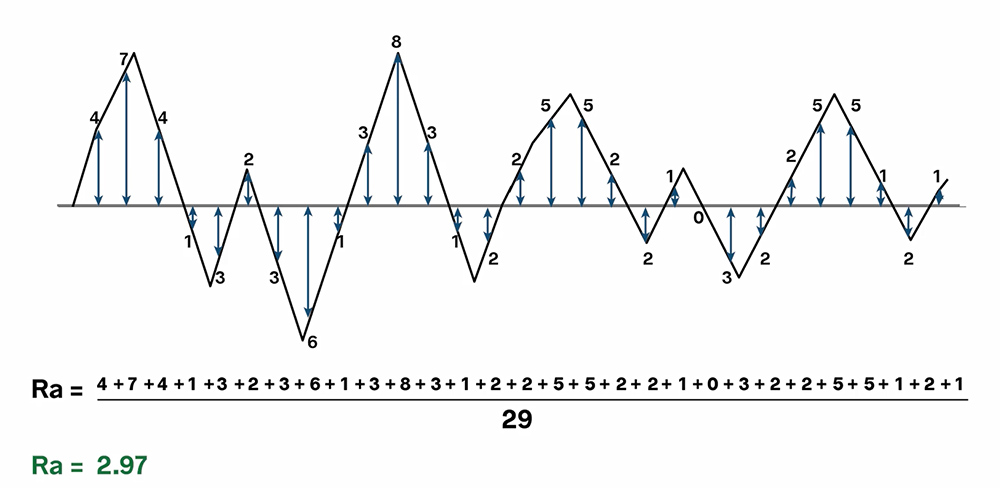
Calculation of average roughness.
Watch the “How Do We Define Ra?” video
Measurement units
Average roughness is measured in microns (µm) or micro-inches (µ‑in). That’s important: Ra has units. You may hear someone describe Ra as a number, like “32.” But while an Ra of 32 micro-inches is typical for an engineered surface, an Ra of 32 microns is more like the surface of a brick!
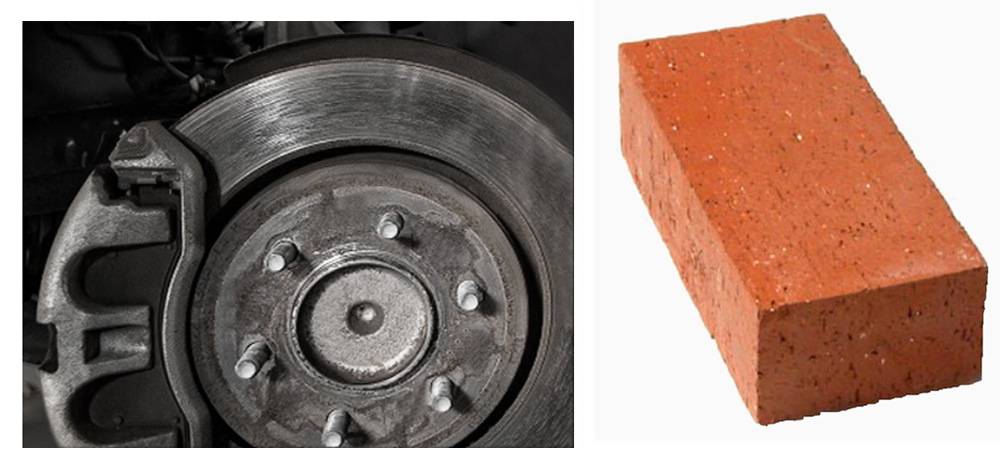
Average roughness has units! Without units, the value is ambiguous.
What Average Roughness can—and can’t—tell us
Average roughness provides a general sense of the overall height of surface texture. It can also indicate when a surface, or the process to manufacture it, has changed in some way.
But Ra can’t always tell us everything we need to know about a surface. Very different surfaces can have the same Ra, so just measuring Ra may not tell you whether you’ve made the surface you intended.
Watch a short animation about surfaces with the same Ra.
a. Ra can’t tell peaks from valleys
First, Ra deals in absolute values, so it can’t tell peaks from valleys. If you need a surface with valleys to hold lubricant, but instead your process is creating peaks, you may not be able to tell from Ra alone.
Average roughness can’t discern peaks from valleys.
b. Ra can’t see the location of features
Ra can’t tell where peaks and valleys occur on a surface. The surface may behave very differently if the peaks are clustered in one location vs being randomly scattered across the surface.
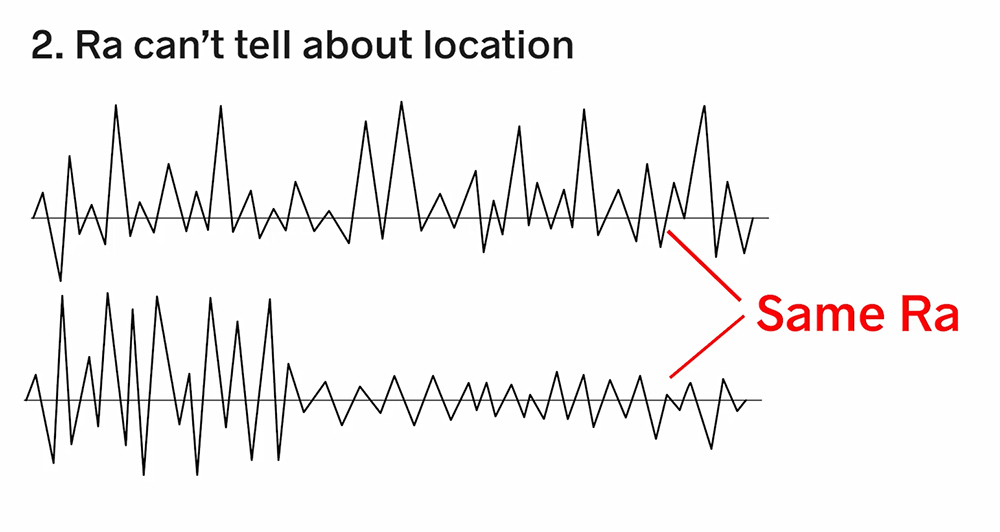
These two surfaces have the same Ra value.
c. Ra Can’t discern feature sizes
Third, Ra does not provide any information about the spatial wavelengths present in a surface. Two surfaces with the same Ra value can have very different spatial wavelength content, and that might lead to distinct differences. As an example, light may reflect differently off the surfaces, leading to very different visual appearances. The composition of spatial wavelengths can also significantly influence fluid flow, friction, and wear characteristics.
Ra vs Sa
Ra is the average roughness along a measurement trace, or profile. It is always calculated over a single trace, like one made by a stylus profiler.
Sa is the 3D average roughness over a measurement area. It is always measured over an area.
While Ra and Sa both measure average roughness, they are NOT interchangeable!
While Ra and Sa both measure average roughness, they are NOT interchangeable! They also are not equivalent to legacy parameters such as Stylus Ra X and Stylus Ra Y, which attempt to extract an Ra value from a 3D dataset.
For some applications, measuring Ra or Sa is sufficient to control a process.
Depending on your application, you may need to track additional parameters such as Rz, Rsk, or Sa, or even a power spectral analysis, to better understand the surface profile.
Want to know more? Set up a complimentary 30 minute meeting, or email us at info@michmet.com!
If you don’t know which cutoff wavelengths were used to get these Ra values, you really have no idea what to believe.
#5 Roughness needs cutoffs
As we’ve stressed throughout this series, “roughness” is a range of feature sizes that matter for an application. It’s not a fixed range! That is, there is no standard value (0.8mm, for example) where we divide “roughness” from “waviness.” The range is unique for the application. The short cutoff wavelength (λs) and long cutoff wavelength (λc) must be specified in order for the roughness, and roughness parameters, to be meaningful.
This rule is stated in all of the major surface texture specifications… and it’s not just an academic exercise. Here’s why.
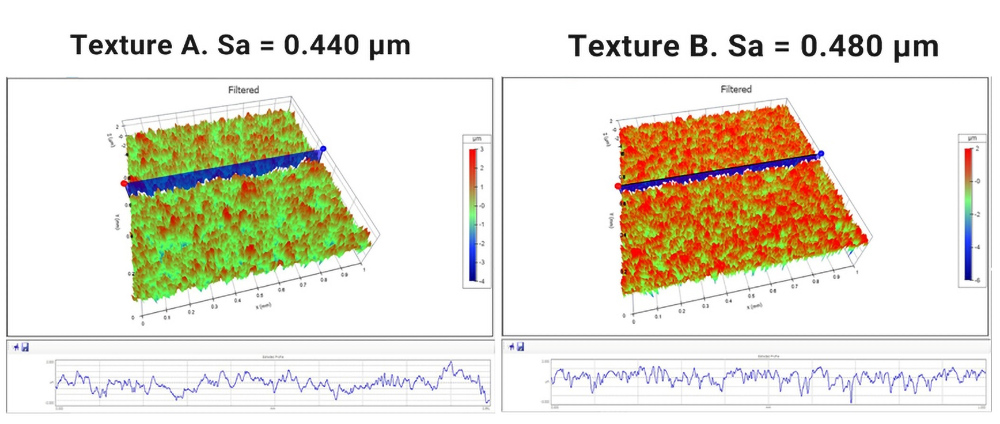
The same surface can have wildly different Ra values
Roughness parameters can have dramatically different values depending on the cutoff wavelengths we select. The image below shows the same surface measurement, but with the roughness cutoff (λc) set to various spatial wavelengths. The average roughness (Ra) changes by a factor of 10 just by changing the cutoff. That’s the same measured data each time—nothing about the surface has changed, only the cutoff!
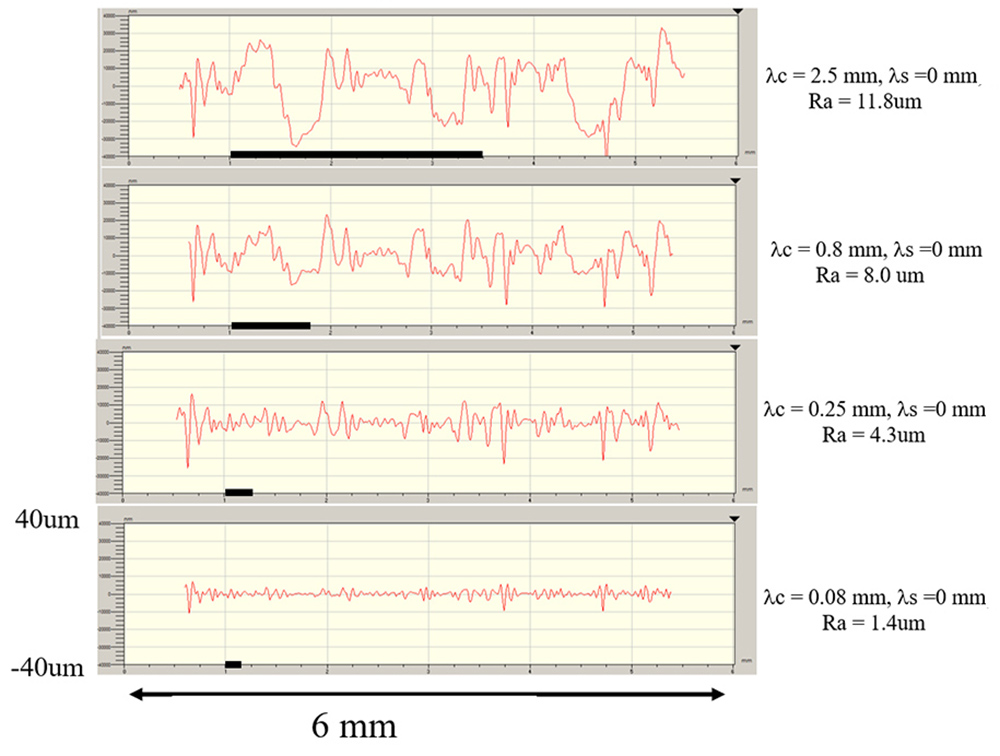
The same surface measurement but with different cutoff spatial wavelengths. The average roughness changes by a factor of 10!
Is the Ra actually 1.4µm and everything is great, or Is it 11.8µm and you need to shut down the process immediately? If you don’t know which cutoff wavelengths were used to get those Ra values, you really have no idea what you should believe!
State the cutoff values: it’s the law!
Because cutoffs are so fundamental, major surface roughness standards like ISO 21920 and ASME B46.1 require that the cutoff wavelengths be specified for any roughness parameter measurement. Specifying the cutoffs ensures that we’re measuring “apples to apples,” with the same filter settings, so that we can meaningfully compare data over time, across instruments, and between facilities. Without the cutoffs, Ra is effectively meaningless.
What if the cutoff isn’t given?
Despite what’s stated in the standards, some drawings (typically older drawings) may specify an Ra value (or another parameter) without the cutoff wavelengths. If you encounter such a situation, the best response is to contact the part designer for recommendations. The designer should know what is required (at least we hope so). When it’s not possible to communicate with the designer, the ISO and ASME standards offer guidance on how to estimate the best cutoff values. It’s an imperfect process, but it sometimes is the best available option. Read our article on the topic in the link below.
#6 Other Surface Parameters
In addition to Ra, dozens of 2D surface roughness parameters, and 3D surface texture parameters, have been developed to describe aspects of surface topography. You can learn more about many of the available surface texture parameters in the Surface Texture Parameters Glossary Here are some of the major parameter categories.
Amplitude parameters
Amplitude parameters describe height (“vertical”) deviations of the surface from the mean plane. This category includes Ra (average roughness), Rz (the average maximum surface height, Rpm (Average Maximum Peak height), Rvm (Average Maximum Valley Depth), and others.
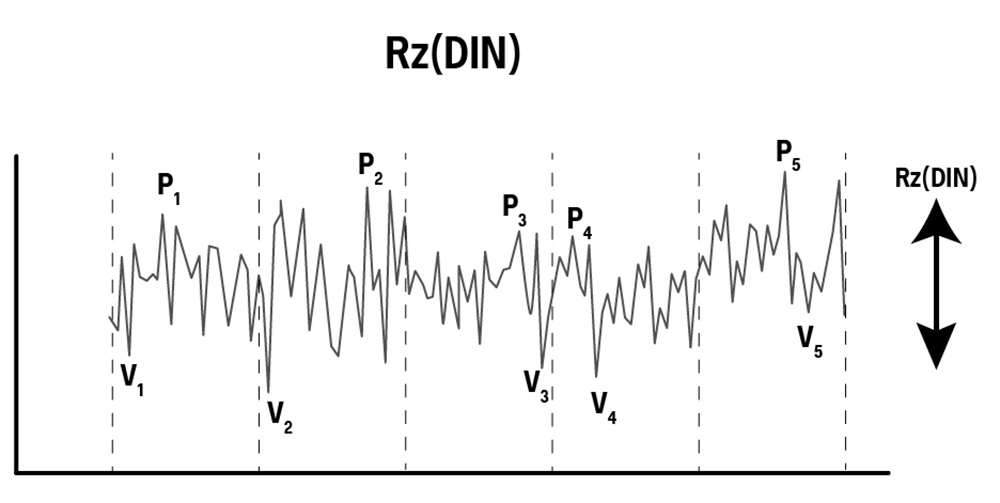
Rz, or the 10-point peak-to-valley height.
Note that various standards define Rz differently. It can be a little complicated. We discuss those nuances in the article When Rz isn’t Rz.
Spacing parameters
This family of parameters is sensitive to the location of, and spacing between, the peaks and valleys in the texture. Spacing parameters may give us important information about how a surface will support a load, how fluid will flow across the surface, etc. The family includes Std (directionality, or lay), and Str (the Texture Aspect Ratio, a measure of randomness of the surface features).
Read how Std affects sealing in this article.
Hybrid parameters
Hybrid parameters give both vertical and lateral information, describing aspects such as the sharpness of the peaks, complexity, etc. They include Sdq (the Root Mean Square Surface Slope), Sdr (Developed Interfacial Area Ratio), and Sds (Summit Density).
Read more about Sds in this article.
Functional parameters
The parameters above describe mathematical characteristics of a surface. Function parameters describe how a surface may perform in a given application. These parameters include Vmp (mr) (the Material Volume, useful in the measurement of wear) and Vvv(p), the Dale Void Volume,
Waviness parameters
Just as Ra is the average of the Roughness Profile, Wa is the average of the waviness profile. Wt is the maximum peak-to-valley height of the waviness profile. Both parameters indicate how much the longer waviness spatial wavelengths contribute to the overall surface texture.
Read how waviness may be the source of noise in this article.
Read about roughness, waviness, and form in this article.
S Parameters
The “R” parameters, such as Ra, are calculated from a 2D roughness profile. For areal 3D measurements we use the “S” (surface) parameters instead. Many S parameters have 2D, “R” counterparts; for example, Sa is the 3D average roughness over an area, akin to the 2D Ra parameter. These terms, however, are not equivalent to their 2D counterparts, and they are not interchangeable.
Read about the differences between Ra and Sa in this article.
3D areal measurements also allow us to see aspects of texture that can’t really be measured in 2D, such as volumes, ridges and dales, etc. Various S parameters and analysis techniques have been developed to describe these areal features of surfaces.
#7 Multi-band analysis
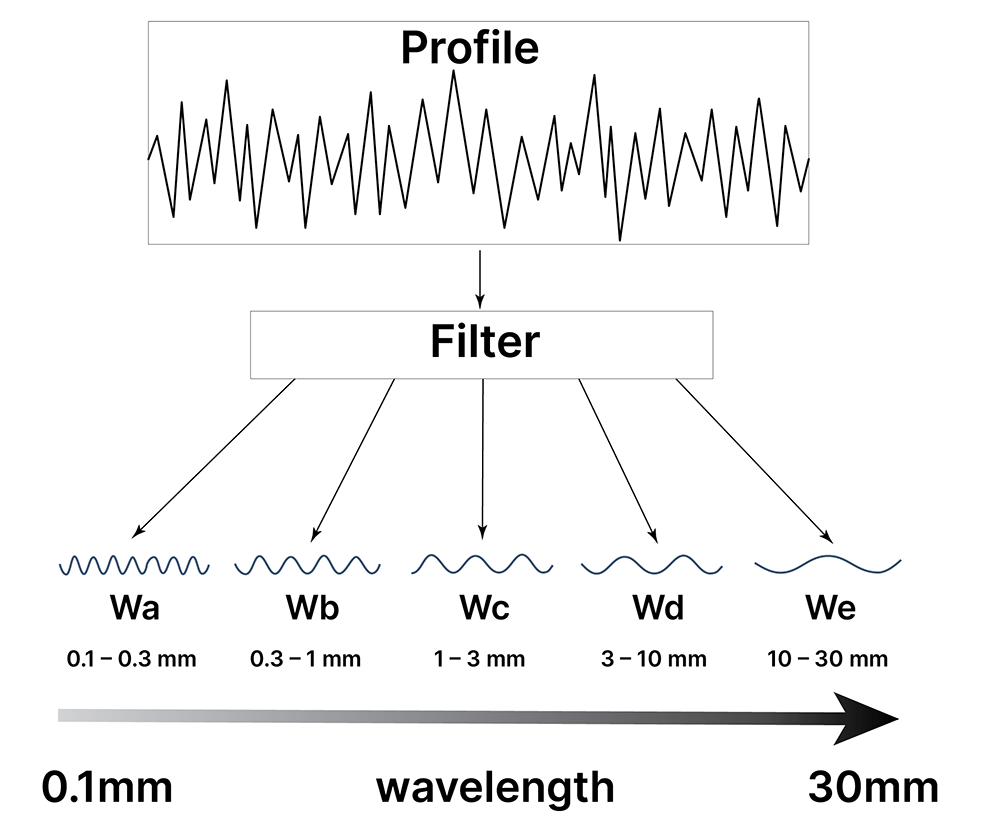
Earlier in this series we showed how filtering divides surface texture into smaller roughness features and larger waviness features. But why stop at two ranges? The answer is: there’s no reason! We can define as many feature ranges as we need to control a process.
In the earliest days of surface roughness measurement, our instruments were only capable of measuring short spatial wavelength features with limited vertical range. We controlled the texture we could measure—namely shorter wavelength roughness. As the lateral and vertical range of our instruments improved, we’ve been able to look at larger features as well, which gives us more tools in our toolbox for analyzing surface quality.
In some applications, it’s useful to break up surface texture into multiple spatial wavelength bands and to specify and control those feature sizes individually. In automotive paint, for example, finishes are often specified over five or more bands. Manufacturers maintain a “recipe” for the acceptable amplitudes in each wavelength band that will combine to produce their intended finish.
Paint finishes may be specified using multiple spatial wavelength bands.
Watch a video on spatial wavelengths in automotive paint
We can specify as many bands of spatial wavelengths as the application requires, provided we also specify the cutoff wavelengths that define the bands.
Read the article, Why does paint appear glossy or matte?
It’s also important to note that the concept of “waviness” is a part of 2D measurement but is not part of 3D measurement. In 3D (areal) measurements, we define spatial wavelength bands with a short filter cutoff (s-Filter) and a longer filter cutoff (L-Filter). We call the features in that range the “SL Surface,” and we can define as many of those surfaces as we choose (SL1, SL2, etc.).
Learn more in our video, How do we define Ra?
#8 Directionality (Lay)
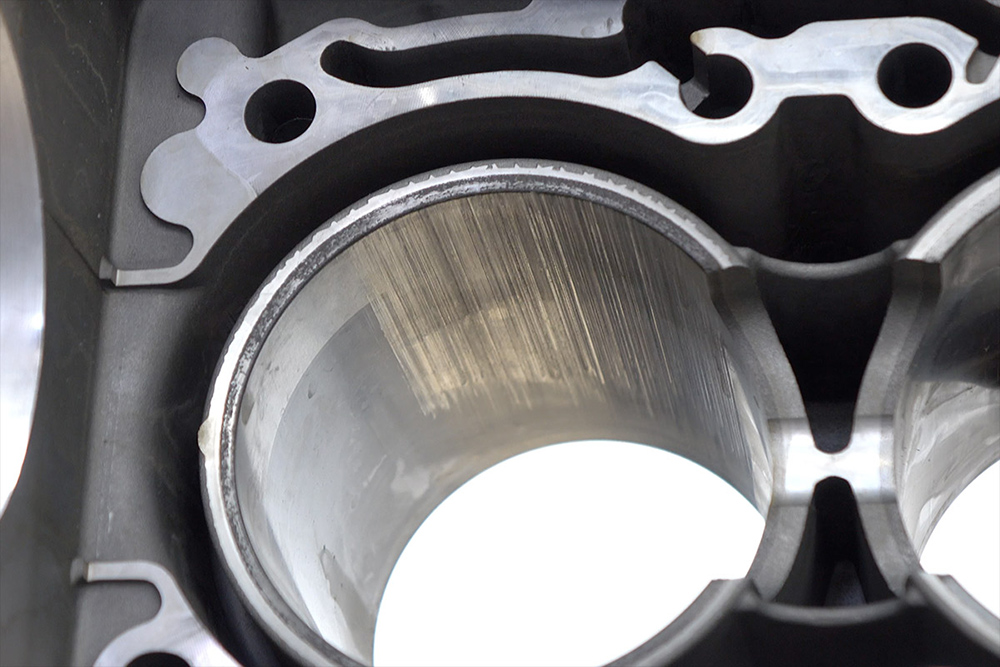
Micro-texture can have a predominant direction known as “lay.” It may be extremely obvious, as in the turned metal sample we showed earlier in this series, or it may be subtle. Either way, lay can be problematic.
Controlling lay is important in many surface functions, chief among them being how a surface will seal with a mating component or gasket. If the direction of the lay is across a sealing interface, then the valleys in the texture can channel fluid through the interface. If the lay runs perpendicular to the leak direction, then the texture can oppose the fluid flow and limit or prevent leakage.
Specifications such as ASME Y14.36 include provisions for specifying the lay, as shown below.
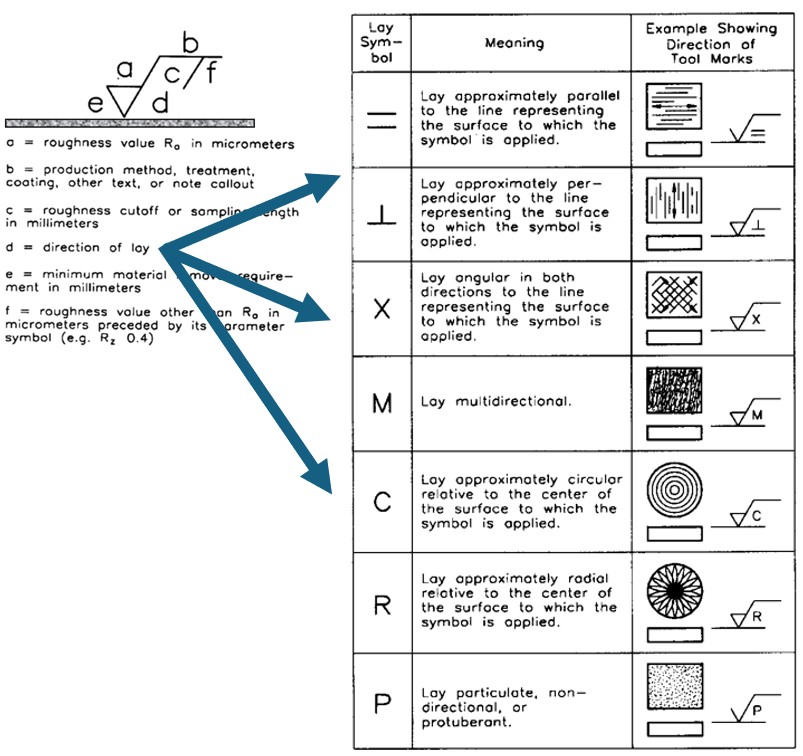
The ASME Y14.36 specification includes provisions for specifying the lay.
Check out the article, Why do seals leak when the average roughness meets spec?
Other surface texture parameters, such as Std (Texture Direction), may also be helpful to determine and control the lay. Str, the Texture Aspect Ratio, may detect subtle directionality in an otherwise isotropic texture.
#9 Feature spacings
While amplitudes get most of the attention in surface texture, the spacings between features can also be critical to how the surface will perform. Surface spacing parameters describe the distance between, and distribution of, peaks and valleys across a surface. These aspects of texture may determine how a surface will interact with light, how fluid will flow over a surface, and the appearance of coatings and finishes. Here are a few examples of spacing parameters and their uses.
Str (Texture Aspect Ratio) is useful in determining the presence of lay (directionality). For a surface produced by multiple processes, Str may detect subtle lay and thus the presence of underlying surface modifications.
Rpc (Peak Density) is a count of the significant peaks per unit length in a profile. Rpc may be useful to optimize the surface texture when the surface will be coated or when fluid leakage/retention are an issue. In aesthetic finishes, the peak count may affect whether a surface may appear hazy, matte, or glossy.
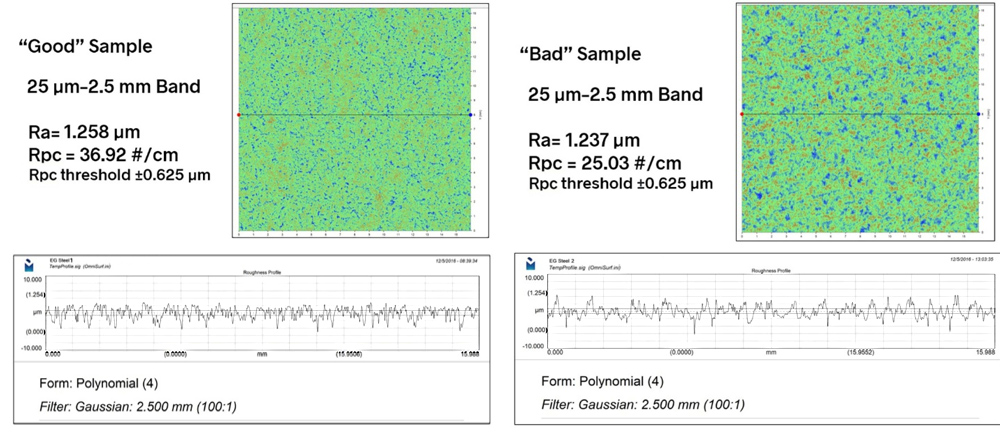
Rpc can explain why these two painted surfaces with similar Ra have different appearances.
Sdq is a measurement of surface slopes. It’s sensitive to “peaky” material with steep slopes, so it can often differentiate surfaces that have similar Sa values. Sdq may be particularly helpful in controlling aesthetic finishes since the parameter is sensitive to the same kinds of texture that our eyes perceive. It may also be helpful in optical applications where certain spacings may scatter light and therefore impact optical performance.
Sdr, the developed interfacial area ratio, identifies the increase in actual surface area due to textural complexity. It informs performance in sealing, lubrication, friction, and adhesion applications.
Sdr can differentiate between these two surfaces with similar average roughness.
#10 Measuring surface texture
Roughness measurement
The earliest surface texture measurements were made by running a needle across a surface, much like a stylus on a record player. These instruments provide 2D traces over the surface, from which surface roughness could be inferred from the sound generated by the surface. Later, chart recorders were employed such that surface roughness parameters could be calculated.
Roughness profilometers
Surface profilers (roughness profilers) that use a sharp stylus to measure remain the most used instruments. While the basic technique remains the same, these instruments are a far cry from the earliest surface roughness recorders. Today, the instruments range from tiny, handheld devices to highly automated instruments that can simulate 3D measurement with a series of 2D traces.
A 2D stylus trace pre-1990.
3D optical profilers
Optical techniques enable non-contact, 3D texture measurement. Optical 3D profilers image areas of a surface in each frame, with high vertical and lateral resolution. 3D optical technologies include white light interferometry, confocal microscopy, etc. Advanced hardware and software analysis has opened new applications for 3D measurement, from semiconductors to biomedical and advanced machining.
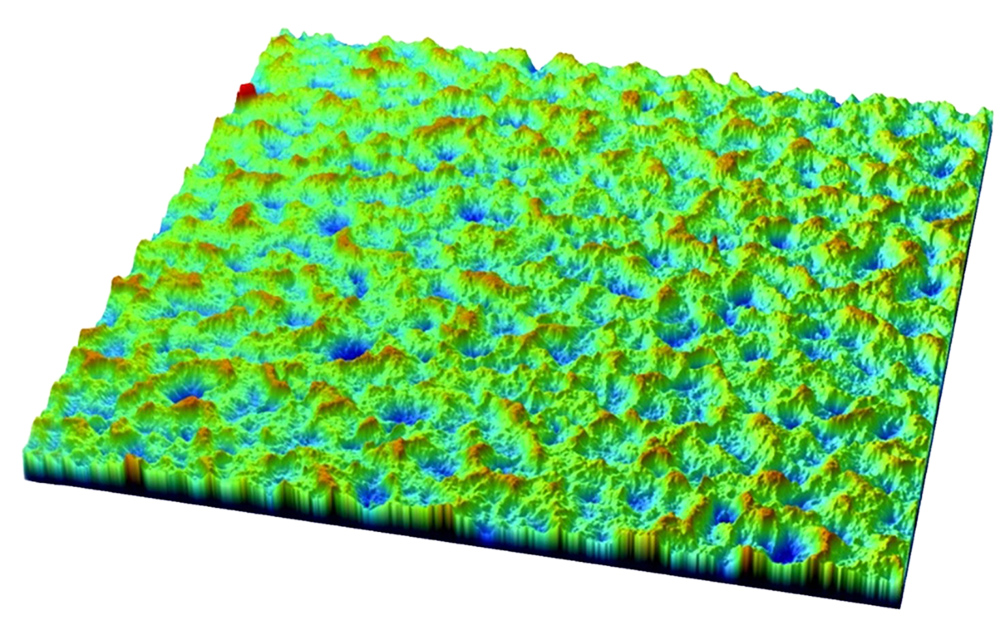
3D optical profiler measurement of a clutch plate reveals individual indentations from shot peening.
State-of-the-art texture measurement
Today, measurement technologies have matured and are now available in an array of formats. We can measure vast areas of surfaces in high resolution, even curved surfaces and difficult to reach features. Massive, stitched measurements like the one below would have been impossible just a few years ago—yet in a lab like ours they are now commonplace.
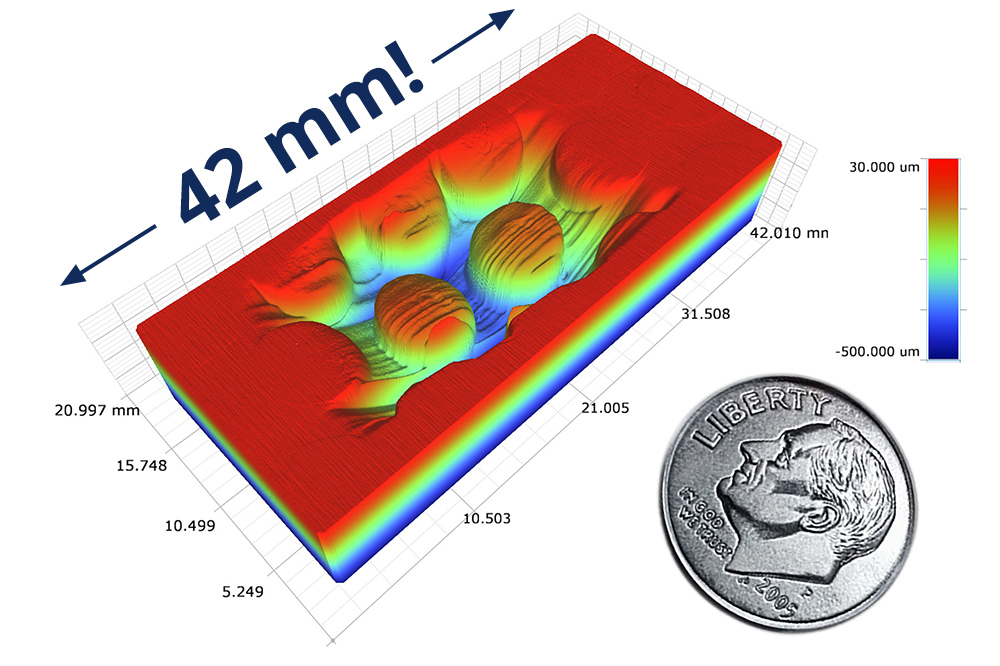
A 20 x 40 mm stitched, high-resolution surface map.
Want more information on surface roughness?
This Roughness Top Ten is a great place to start to expand your knowledge of surface roughness and texture. Want to go further? Check out the many Resources that we have assembled here at michmet.com, including articles, videos, animations, and our Surface Texture Parameters Glossary.
For a deep dive into surfaces, check out our live and online Surface Roughness, Texture, and Tribology classes. Our next class is coming up fast, so register today!
And, for more personalized assistance, schedule a complimentary 30-minute consultation wtih us! We love to talk surfaces, and we’d be glad to help.